Building a reliable notification system
Notifications are essential for delivering real-time updates on relevant and critical information to users, with the ultimate goal of increasing user engagement on a platform. A notification system acts as a service, delivering messages to users through various channels such as in-app notifications, emails, or even messaging platforms like Mattermost.
At Contentsquare, notifications are used in multiple products and by different teams serving a wide range of purposes. Their usage spans from updates about customers’ actions on the platform such as password resets, to critical notifications about exceeded API quotas or automatic notifications from AI-powered alerts.
Given that the notification system is regularly updated to support additional channels and most of the teams rely on it, ensuring the system’s reliability and top-notch observability is paramount.
Observability plays a crucial role in such a system by ensuring a comprehensive understanding of its internal state and behavior, enabling effective analysis and issue resolution, especially in critical scenarios such as system failures or crashes.
In this article, we will discuss the challenges we faced, provide an overview of our architecture, and share insights about how we improved the observability of our system.
Journey of a notification
Although all usages of the notification system hold value, we will focus on the journey of a notification in our Alerting module since it is the most complex use case we currently have.
Within this module, our customers can monitor key business metrics on their platform, such as Conversion Rate or the Number of Users experiencing a specific API error on their platform. They will get notified whenever our pipeline detects unusual behavior. The following schema illustrates a scenario where a customer may want to receive notifications when there is an API error that prevents a visitor on their website from validating their shopping cart.
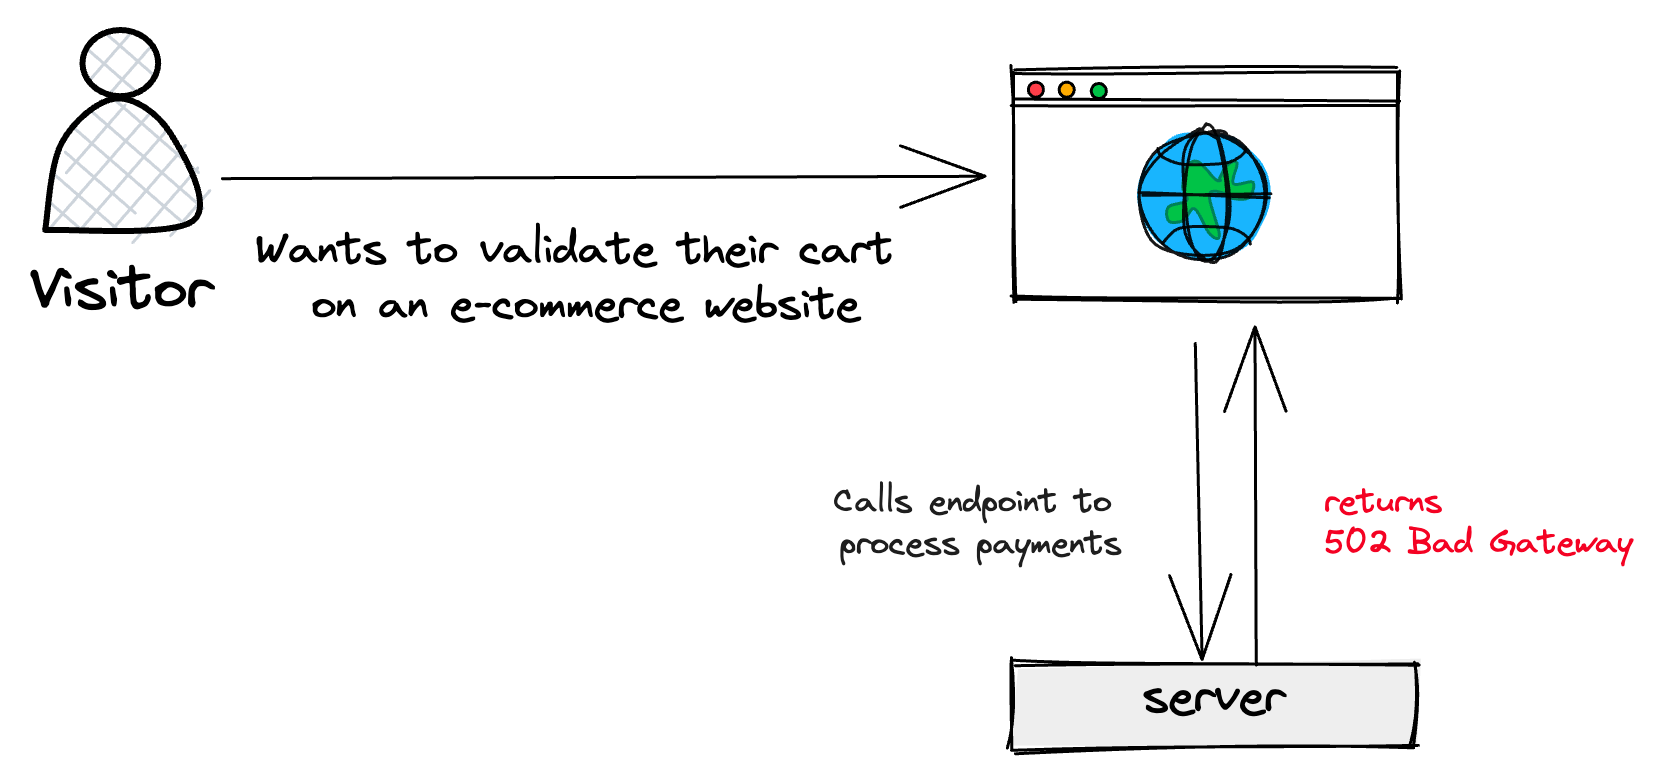
To monitor these API errors, the customer can create an alert in our interface. It will then trigger real-time notifications when an incident begins, until it is resolved. When an anomaly is detected, our Alerting microservice triggers a notification which is then processed and sent by our Notifications microservice to the customer’s preferred channel.
Currently, we send out around 40,000 email notifications each week. It’s important to mention that the Alerting solution is in a progressive roll-out phase and is accessible to 5K out of approximately 100K users. Considering the progressive roll-out and the growing adoption, it’s vital to ensure that we can manage a high volume of notifications efficiently.
Since our system is used by different products, such as Workspace and the Alerting modules, with different requirements, it must be user-friendly and flexible enough to accommodate these diverse needs.
To better understand the challenges we are facing, let’s dive into our system architecture.
Overview of the notification system
Our architecture revolves around microservices leveraging Kafka for asynchronous communication between microservices. Microservices allow each team to be independent and to have better ownership of their business components. Most products at Contentsquare have a dedicated microservice that handles their business logic. As such, we have a microservice responsible for sending notifications.
There are multiple components involved in the process of sending the notifications. In the upcoming sections, we will explore each part of the notification system.

Notification Consumer
The consumer is in charge of capturing all the Kafka events produced by other microservices in the Notifications topic to send notifications.
For instance, whenever the Alerting pipeline detects an incident, the Alerting microservice will produce a Kafka event called AlertNotification. The payload of this event contains relevant information regarding the notification that will be sent, such as the identifiers to related entities (alert in this case).

Once events are captured, the consumer orchestrates the entire logic to process and send the notification based on the customer’s channel. Both the Mailer and Integration components are using the templating system to build the notification text before sending the notification.
Templating System
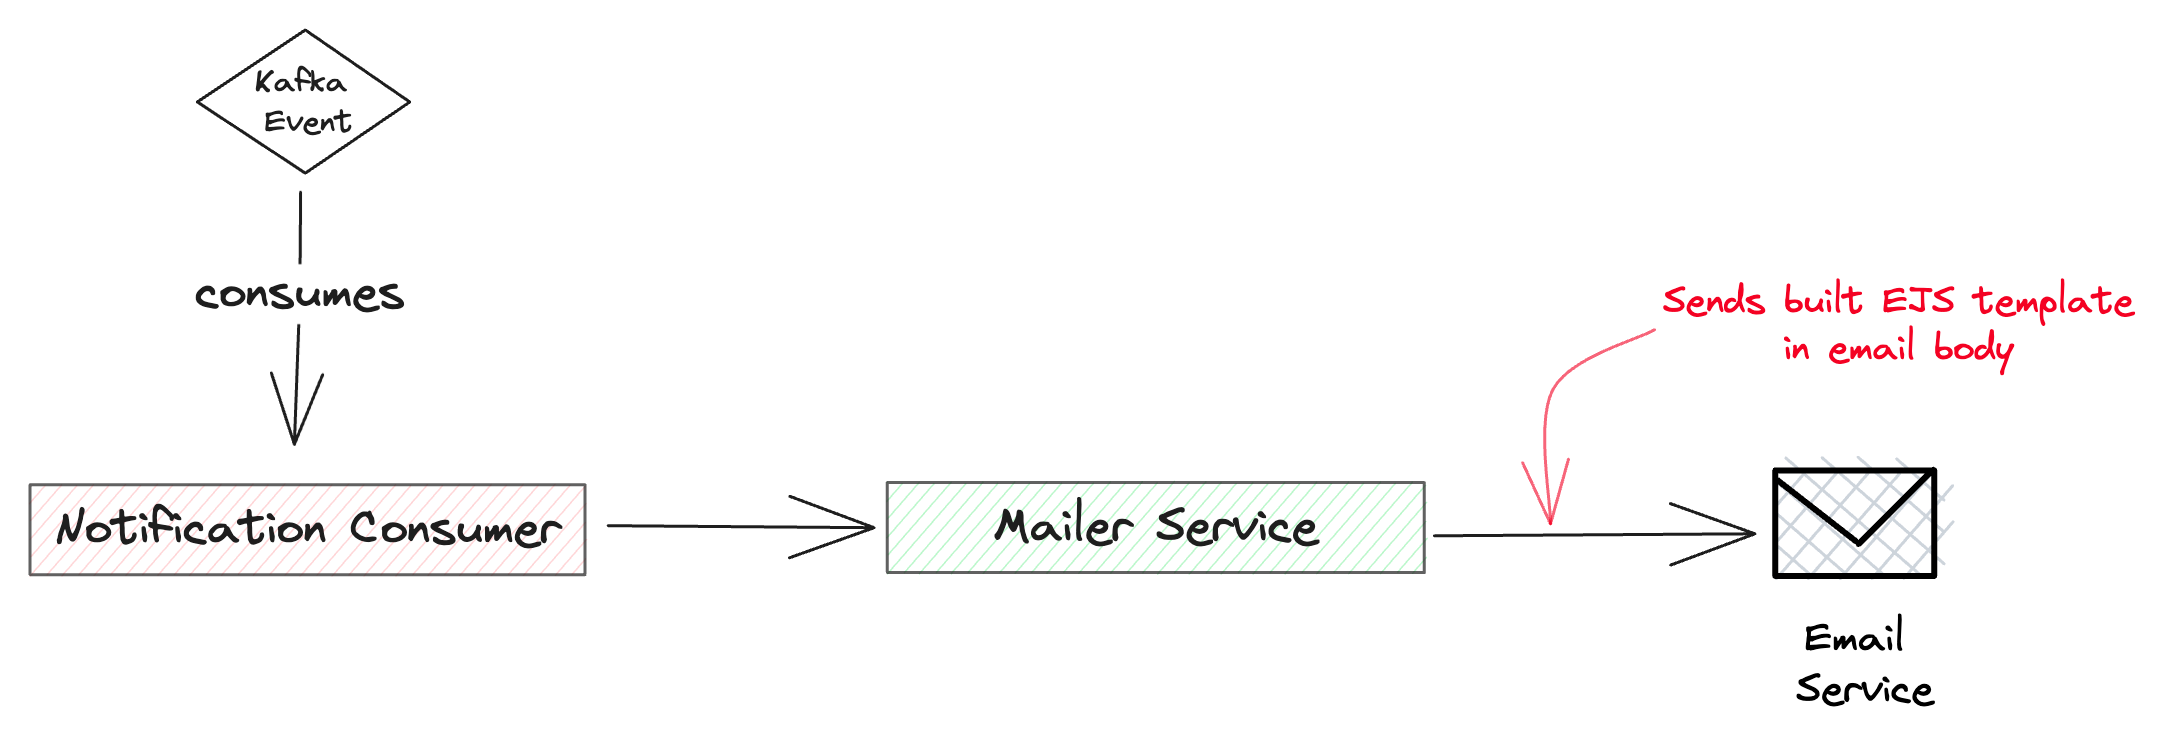
The templating system handles styles, translations, and dynamic value injection in the templates. We are using EJS for email templates due to its simplicity and flexibility. When a customer has enabled email notifications, the consumer will use the Mailer service that has built-in methods to build the corresponding EJS template and get the email body that will be sent to the email provider.

When a customer has enabled Slack or Microsoft Teams notifications, the consumer will use the Integration service to prepare the message that will be sent to the appropriate channel.
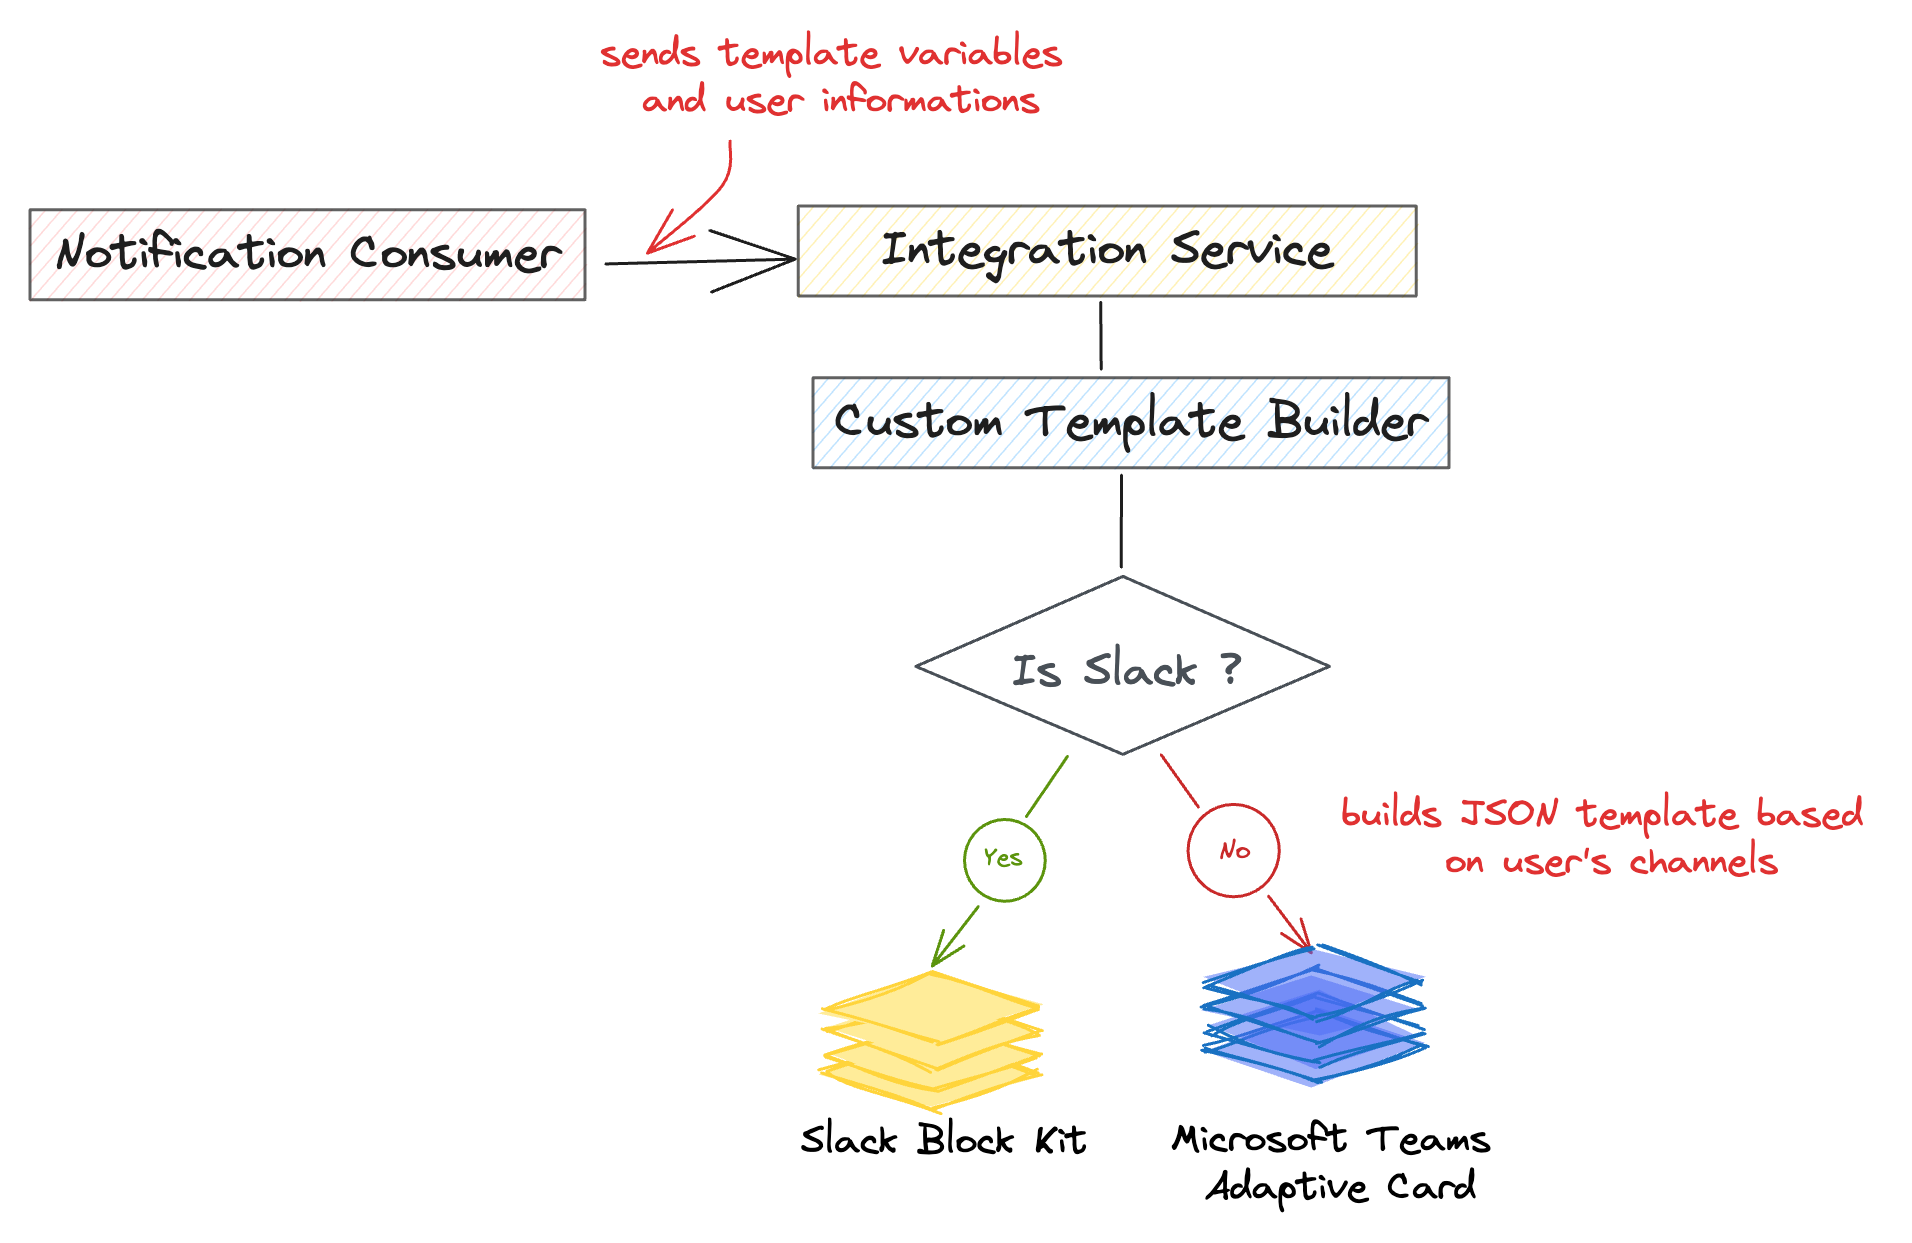
We are using Slack’s Block Kit and Microsoft Teams Adaptive Cards to format and style our messages. To do so, we heavily rely on JSON as the foundational structure for defining the interactive components of our messages. The JSON structure allows us to easily define the structure, content, and behavior of these components for both notification channels.
Sending notifications
To send the email notification, we use our cloud provider’s SDK and we include the built EJS template in the email body.
Slack and Microsoft Teams have completely different logic for publishing a message in a channel. To handle the specific requirements of each messaging platform, we have dedicated microservices that store the different configurations and publish the message in the selected channels.
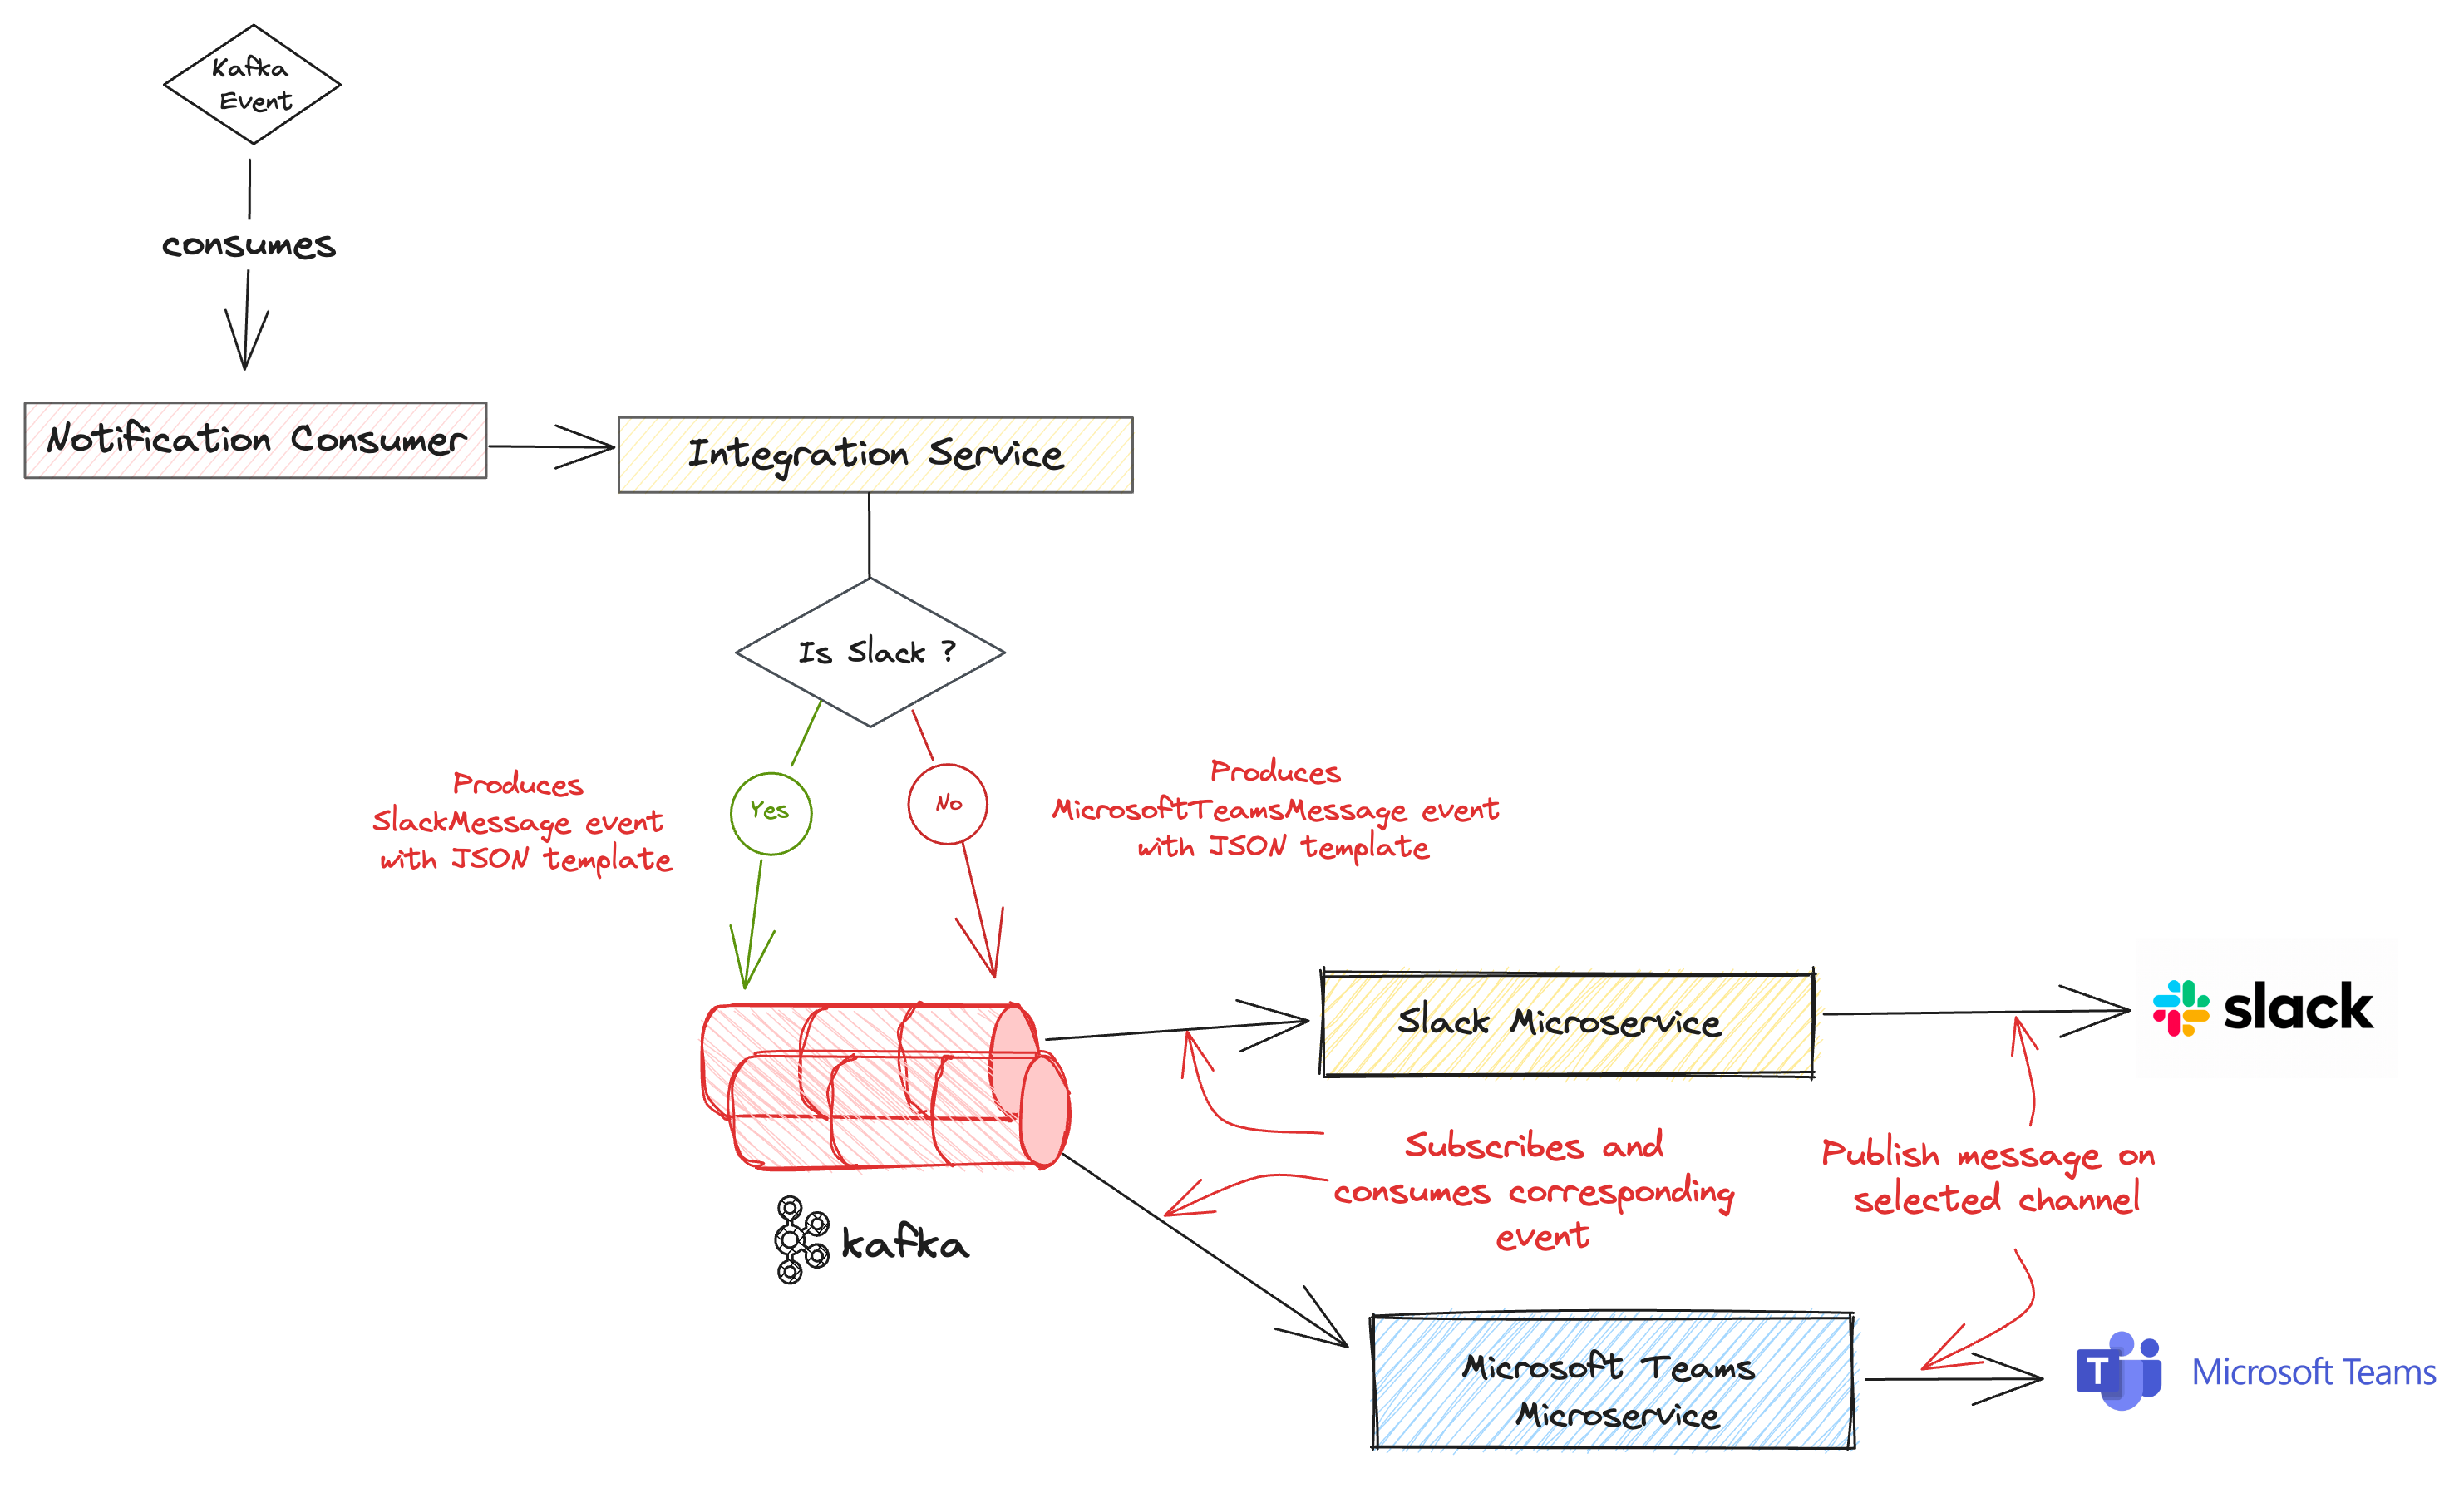
The Notifications microservice will produce Kafka events consumed by those services whenever a customer has selected Slack or Microsoft Teams.
To monitor and for BI (Business Intelligence) purposes, we store metadata related to the notifications sent such as the date when the email was opened in an SQL database. This data is stored for 60 days before being automatically deleted by a cron job. This period ensures that the data is available for monitoring and analysis while efficiently managing storage resources.
Overcoming Scalability challenges
We encountered several bottlenecks along the way that led us to scale and enhance the reliability of our system. One notable challenge was the fact that we initially used a single Kafka topic for inter-microservice communication, before creating the Notifications topic. This had been working well before we launched the beta of real-time alerts.
During the beta phase, the Alerting service generated a significant volume of events, exceeding the consumption capacity of the Notifications service. For example, if one customer had 50 real-time alerts they could trigger 600 notifications every hour. Considering a scenario with only 30 customers, each having 50 real-time alerts, it could result in a staggering 18K notifications sent every hour. As you see, it doesn’t scale well as the number of notifications will continue to increase as the number of customers grows.
Additionally, latency issues arose on one specific API call made for the UI. On our Notification Center, we display the list of new notifications that were not seen by the customer. The latency was due to the absence of pagination support on that page, resulting in the need to retrieve a large number of notifications at once.
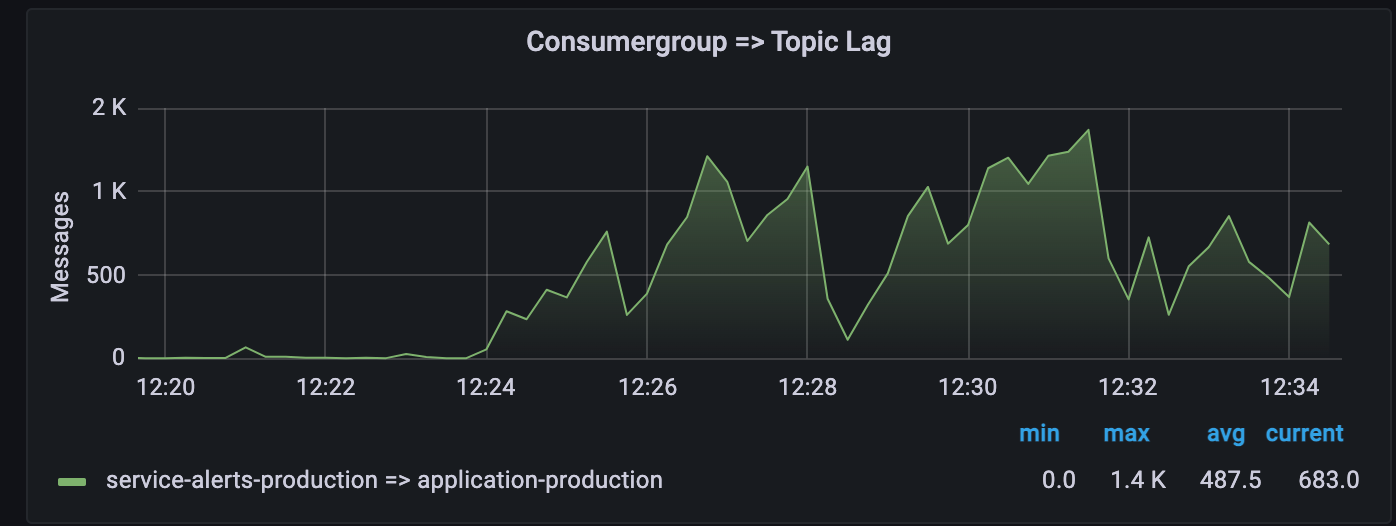
Despite implementing the Snooze feature to prevent false positive notifications, the system still generated an excessive number of notifications. This overload caused our monitoring tool to trigger multiple alerts regarding Kafka lag because the Notifications service was not designed to handle such a high load.
To address these issues, we implemented several measures. To start with, we optimized the storage of notifications and implemented a retention period to manage their lifecycle. Furthermore, we created a dedicated Kafka topic specifically for notification events. This approach effectively reduces the load on the main Kafka topic, which is used by other services for communication, and also facilitated more efficient processing.
Path to Observability
Despite having comprehensive logging and tracing mechanisms throughout the notification journey, we had some observability issues specifically related to email delivery.

Relying on an external email service without full visibility into its inner workings can create a black-box scenario. We encountered a situation where a customer reported not receiving a specific email, despite our system indicating that the email was successfully delivered.
To find the root cause, we thoroughly examined the logs at different steps of the notification journey. Our investigation was geared towards understanding whether the problem originated from our system—such as a template rendering failure—or from the external service. After extensive research, we found it was due to SPF (Sender Policy Framework) alignment not being configured, which was quite an obvious issue. Consequently, we collaborated with the Security team to configure the SPF accordingly.
Investigating that issue proved to be exceptionally difficult and made us invest significant effort into improving the observability of our system.
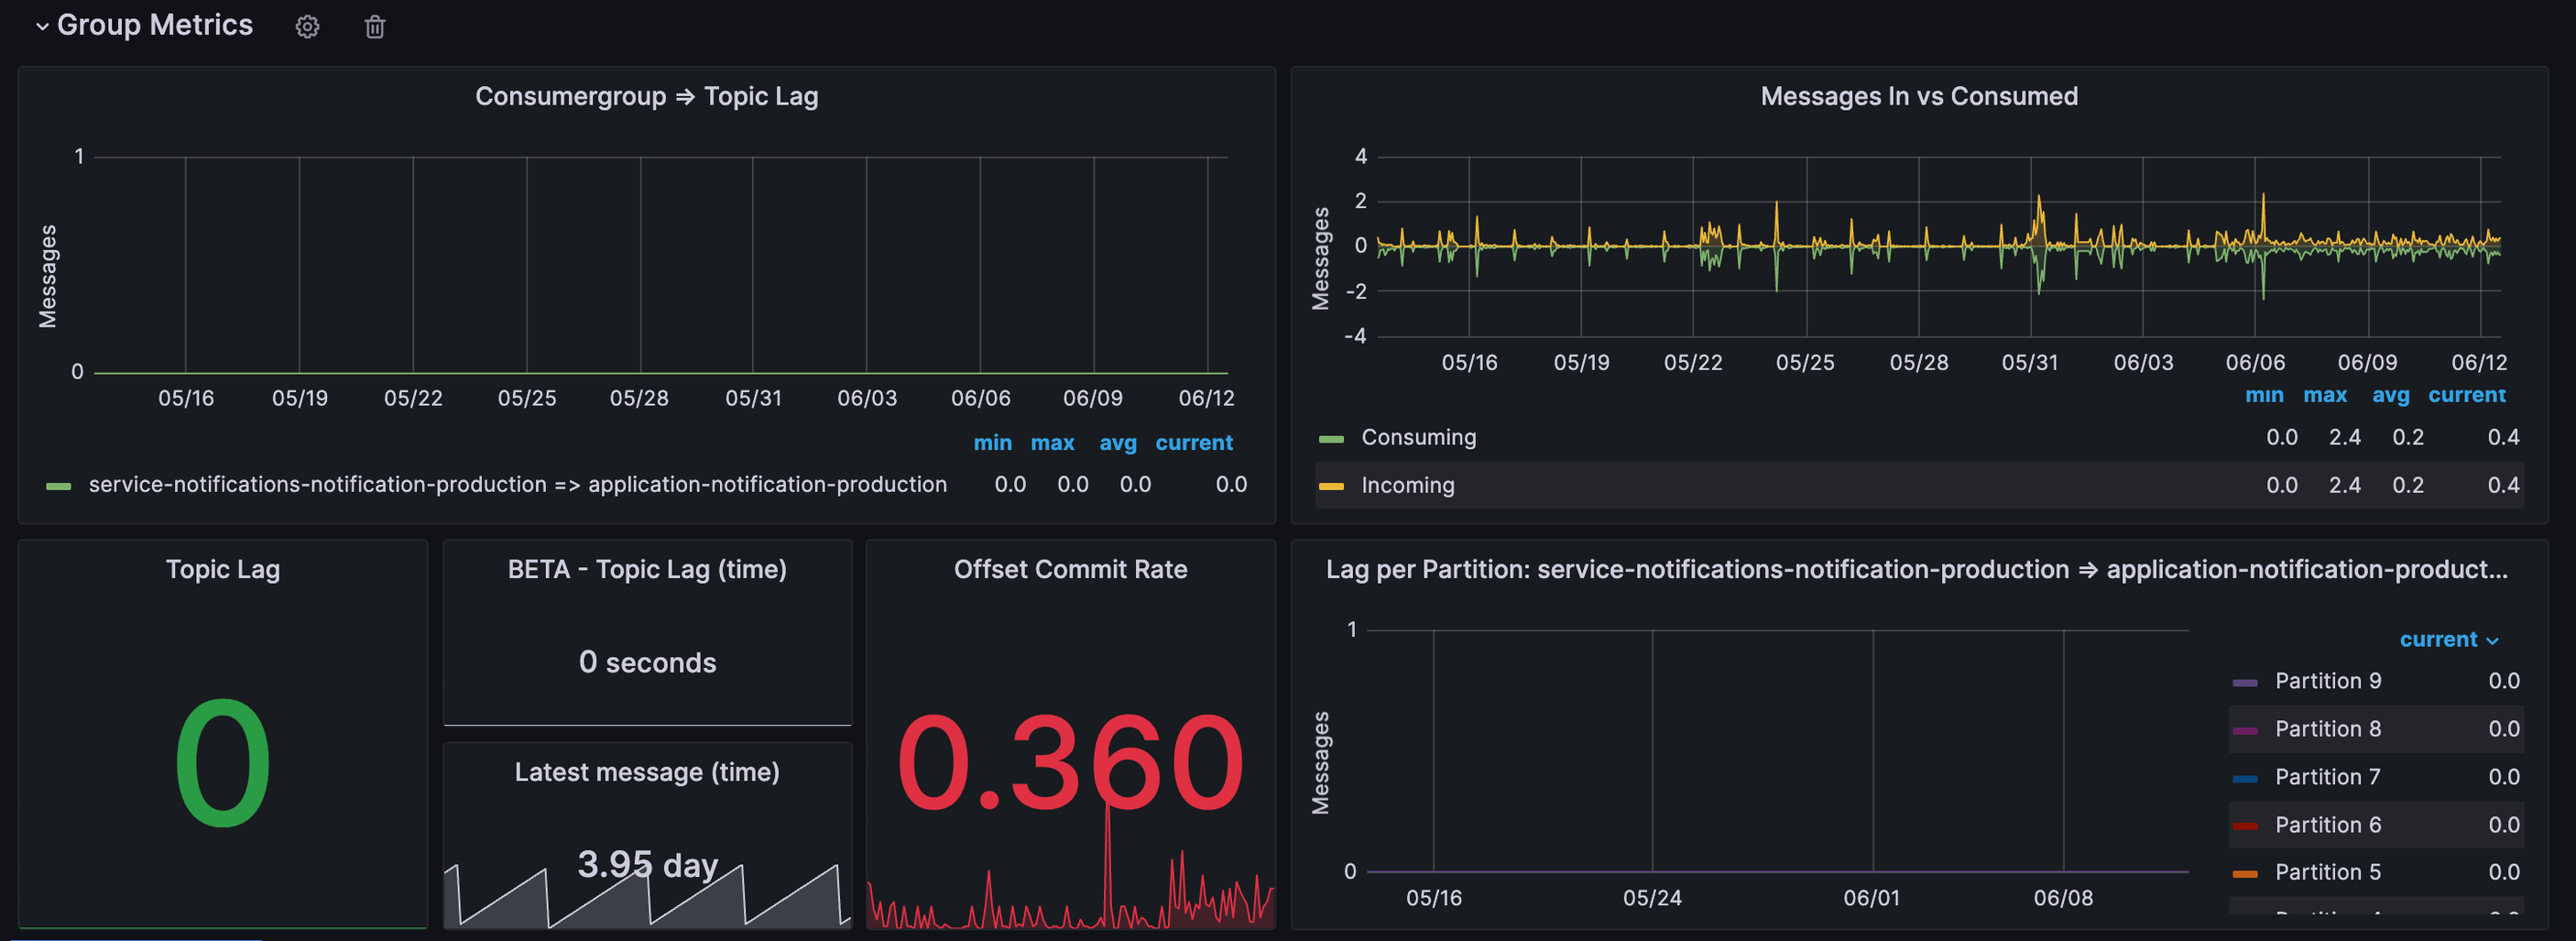
To achieve this, we built a Kibana dashboard to monitor and analyze logs and a Grafana dashboard to monitor cloud resources used for notifications. We also integrated dashboards used by other teams to monitor Kafka resources into our monitoring routine. By using those dashboards, we now have robust tools for monitoring, bug investigation, and ensuring system stability.
Email observability tool
We developed an internal tool specifically designed to improve the observability of our email notification system and gain comprehensive insights into an email’s journey within the email service.
The external email service we are using can be configured to collect a range of events associated with email interactions. These events are really useful for both troubleshooting and Business Intelligence purposes. For example, in the event of a Template Rendering failure, we can use the captured data to identify and address any issues arising from missing or non-compliant variables that may affect the rendering process. On the other hand, events like Open are useful for Business Intelligence purposes because they allow us to better understand how users are interacting with emails.
This tool enables us to capture events generated by our cloud provider’s email service granting us visibility into the complete lifecycle of an email once it reaches this service.

To do so, we are consuming events from the email service every minute, logging and storing the metadata associated with it in an SQL database. As a result, when troubleshooting email issues, we can leverage both Kibana and our database to query and access relevant information efficiently.
Wrapping up
Our journey to building a robust and reliable notification system has been filled with significant challenges and valuable lessons. Throughout this blog post, we provided an overview of our notification system and discussed the challenges we faced along the way and how we solved them.
By addressing our scalability challenges and improving the observability of our notification system, we effectively mitigated user frustration and instilled greater trust in our solution.
We still have a lot of interesting work to do to make it more robust, reliable, and flexible. Here are some projects we have on our roadmap:
-
Developing a fallback mechanism to ensure uninterrupted delivery of notifications even in challenging scenarios such as system failures or crashes
-
Achieving near real-time delivery with notifications reaching customers in less than a minute
Our journey has taught us the importance of scalability, observability, and continuous improvement. We hope that the lessons we learned along the way will give you a good idea of how to build a notification system at scale and how to make it more reliable.