Ten Flink Gotchas we wish we had known
Adopting a new framework always comes with its share of surprises. It is not unusual to spend days figuring out why our service behaves in an unexpected way, only to find out we were misusing a feature or missing a simple configuration line.
At Contentsquare, we constantly need to upgrade our data pipeline to keep up with increasingly demanding features on more and more data. This is why we decided to migrate our hourly Spark job for Sessionization to a streaming service using Apache Flink. Doing so allowed us to serve fresher data to our clients, as well as enabling enrichment of historical data, with an even more robust pipeline. It did not come cheap though, our team worked for a year to make sure everything was going as planned. And, as stated above, we faced quite a few surprising problems! This article will try to help you avoiding these pitfalls if you embark on a similar journey.
1 - Workloads skew due to parallelism settings
Let’s start with a simple problem: when investigating a task’s subtasks in the Flink UI, you may encounter a strange pattern regarding the amount of data handled by each subtask.

This indicates that the operators inside each subtask do not receive the same amount of Key Groups, which represent a slice of the total number of possible keys. If a given operator receives 1 Key Group while another receives 2, the second subtask will most likely have twice as much work to do. Looking into Flink’s code, we can find this function:
public static int computeOperatorIndexForKeyGroup( int maxParallelism, int parallelism, int keyGroupId) { return keyGroupId * parallelism / maxParallelism;}Its purpose is to distribute all Key Groups to the actual operators. The total number of Key Groups is determined by the maxParallelism argument, while the number of operators is equal to parallelism. This is fine, but what is more problematic is the default value for maxParallelism, which is set to operatorParallelism + (operatorParallelism / 2). This means that, if you set your parallelism value to 10, the default maxParallelism will be 15.
Using the above function, we can compute which operator will be assigned to each Key Group:

Fixing this is quite easy: when you set your parallelism value, also set a value for maxParallelism that is a multiple of your parallelism. This will evenly distribute workload and allow for scaling later on.
2 - Be careful with mapWithState; or the importance of TTLs
Thinking about keyed state retention (with TTL timers to clean up unused data after a given amount of time) is really important when dealing with unbounded key spaces. The term unbounded is a bit misleading here, because if your keys are encoded on 128 bits, there is a bound to the maximum number of keys (equal to 2128). But this is a huge number! You cannot possibly store that many values in your state, so it is better to consider your key space to be unbounded as long as new keys will continue to appear over time.
If your keyed state is contained in one of Flink’s default windows, you will be safe: even though no TTL is used, a cleanup timer will be registered when processing the window’s elements, which will call the clearAllState function, deleting the state associated to the window and its metadata.
If you are managing your own state with a Keyed State Descriptor, it is really easy to add a TTL configuration to make sure the number of keys kept in your state is not growing indefinitely.
But you might also be tempted to use the handy mapWithState method, which lets you access a valueState while hiding the complexity of creating it yourself. While this is fine for tests and small number of keys, it will cause problems in production for unbounded key spaces. Since the state is hidden from you, you cannot set a TTL, and none is configured by default. This is why it might be worth considering doing the extra work to declare something like a RichMapFunction instead, which will give you more control over your state’s lifetime.
3 - Restoring and re-partitioning from checkpoints
When working with large states, it becomes necessary to use incremental checkpointing. In our case, the full state of our job is around 8TB and we configured the checkpoints to happen every 15 minutes. Since the Checkpoints are incremental, we can manage to send only about 100GB to object storage every 15 minutes, which is way faster and less network-intensive. This works well for fault-tolerance, but we also need to retrieve our state when updating our job. The common way to do this is to create a Savepoint for the running job, containing the whole state in a portable format.
In our case though, Savepoints could take several hours to complete, which made every release a long and bothersome process. Instead, we decided to use Retained Checkpoints. Setting this up allowed us to speed up our releases by restoring the state from the previous job’s Checkpoint, instead of having to trigger a long Savepoint!
But there is more. While Savepoints are more portable than Checkpoints, you can still use Retained Checkpoints to change the partitioning of a job (it might not work on all types of jobs though, so it is better to test it out). This works exactly like re-partitioning from a Savepoint, except that Flink will have to go through a long process for redistributing the data across the Task Managers. When we tried it, it took about 8 hours to do so, which was not sustainable. Fortunately, since we were using the RocksDB state backend, we could allow more threads for this step and increase its speed. This was done by increasing these two settings from 1 to 8:
state.backend.rocksdb.checkpoint.transfer.thread.num: 8state.backend.rocksdb.thread.num: 8Using Retained Checkpoints and increasing the number of threads allocated for RocksDB’s transfer helped us reduce our release and re-partitioning time by a factor of 10!
4 - Logging before it is too late
This one might appear obvious, but it is also easy to forget. When writing your job, remember that it will be running for a long time and unexpected data might arrive. When such a case happens, you will need to have as much information as possible to investigate what happened without having to re-create the problem by ingesting the same data again.
In our case, we are aggregating events together and merging them depending on specific rules. It is not uncommon for some of these rules to run with acceptable performance on most cases, but to take a really long time when the data is skewed in unexpected ways. We learned that the hard way when we found our job being stuck for 3 hours, with no idea what it was doing. Only one TaskManager’s CPU seemed to be working so we suspected that a specific piece of data was causing our algorithm to perform badly.
When the data was finally processed, everything went OK again, but we had no idea where to check! This is why we added some preventive logging for these cases: when we are processing a window, we measure the time spent. Whenever the window takes more than 1 minute to be computed, we log everything we can about it. This is a tremendous help to understand exactly what kind of skew is causing a performance dip, and when it happened again we were able to find the part of our merging process that could indeed take hours if we received duplicates. Of course, it is important not to log too much information too often as it will degrade performance, so try to find a threshold that only shows information when it is an abnormal case.
5 - How to find out what your stuck job is actually doing
Investigating on the above problem also made us realize we needed to find a simple way to check what piece of code is currently running when the job appears stuck. Fortunately, there is an easy way to do that! First, you will need to configure your TaskManagers’s JMX to accept remote monitoring. On our Kubernetes deployment, we could connect to JMX in three steps:
- First, adding this property to our configuration:
env.java.opts: "-Dcom.sun.management.jmxremote -Dcom.sun.management.jmxremote.authenticate=false -Dcom.sun.management.jmxremote.ssl=false -Dcom.sun.management.jmxremote.local.only=false -Dcom.sun.management.jmxremote.port=1099 -Dcom.sun.management.jmxremote.rmi.port=1099 -Djava.rmi.server.hostname=127.0.0.1"- Then, forwarding the local port 1099 to the one in our TaskManager’s pod
$ kubectl port-forward flink-taskmanager-4 1099- Finally, opening
jconsole
$ jconsole 127.0.0.1:1099This easily lets you see information on the JVM for the TaskManager your targeted. For our stuck job, we targeted the only TaskManager that was working, and we analyzed the running threads:

Digging deeper, we could see that all threads were currently waiting, except for one (highlighted in the above screenshot). This allowed us to quickly spot which method was struggling to finish when the job was stuck and to fix it easily!
6 - The risks of moving data from one state to another
Depending on your use case, it might be relevant to hold 2 different state descriptors with different semantics. For example, what we do is we accumulate events for ongoing sessions in the WindowContent state, and then move the processed sessions in a ValueState called HistoricalSessions. This second state is kept for a few days in case we need to enrich this data, until we discard it with a TTL.
The first tests we did worked well: we could send additional data to an already-processed session, which would create a new window for the same key. During the processing of the window, we fetched the data from the HistoricalSessions state to merge the new data with the old session, and the resulting session was an enriched version of the historical session, as expected.
While implementing this, we ran into memory problems on a few occasions. After a few tests, we understood that the OOM only happened when we sent old data to Flink (that is, sending data with a timestamp that is older than its current watermark). This allowed us to understand one big problem in our approach: when old data was received, Flink was merging it with the old window, whose data was still inside the WindowContent state (this is possible thanks the AllowedLateness setting). The resulting window was then merged with the HistoricalSessions content, which also contained the old data. What we ended up with was duplicated events, and after a few events were received for the same session we would have thousands of duplicates for each event, leading to the OOM.
Fixing this was quite simple: we wanted the WindowContent to get automatically cleared before we moved its content to our second state. We did this by using Flink’s PurgingTrigger, which sends a message that clears the state’s content when the window fires. The resulting code looks like this:
// Purging the window's content allows us to receive late events without merging them twice with the old sessionval sessionWindows = keyedStream .window(EventTimeSessionWindows.withGap(Time.minutes(30))) .allowedLateness(Time.days(7)) .trigger(PurgingTrigger.of(EventTimeTrigger.create()))7 - Reduce VS Process
As described above, our use of Flink relies on accumulating data for a given key and merging all this data together. This can be done in two ways:
- accumulate the data in a
ListStatecontainer, wait for the end of the session and merge all data together when the session ends - merge each new event with the previous ones as they arrive, using a
ReducingState
Using one state or the other depends on the function you are running over the WindowedStream: calling process with a ProcessWindowFunction will use a ListState, while calling reduce with a ReduceFunction will use a ReducingState.
The advantages of the ReducingState are quite obvious: instead of storing all the data for the window until processing, we are continuously aggregating it inside a single record. This often results in a smaller state, depending on how much data gets discarded during your reduce operation. For us, it represented little improvement in terms of storage because this state’s size was negligible when compared to the 7 days of data we stored for historical sessions. In contrast, we noticed a performance improvement by using the ListState instead!
This is due to the fact that the continuous reduce operation needs to de-serialize and serialize data every time a new event arrives. This can be seen in the RocksDBReducingState add function, which calls getInternal, causing a de-serialization of the data.
However, to update the value in a ListState using RocksDB, we can see that no serialization is done. This is thanks to the fact that the RocksDB merge operation lets Flink append data to a RocksDB value, without needing de-serialization.
In the end, we selected the ListState approach, because the performance gain was beneficial to reduce latency, while the storage impact was quite small.
8 - Don’t trust input data!
Never ever make any assumption that your input will be as you expect it to be. Things can go wrong for many different ways, causing your job to receive skewed data, duplicates, unexpected spikes, invalid records… Always assume the worst and protect your job from the consequences.
Let’s quickly define a few key terms for later:
- “pageview events” are the main information that we receive. They are triggered whenever a visitor loads a URL on one of our clients, and contain information like a
userId, asessionNumberand apageNumber - “sessions” represent the sum of all interactions that a user has made without leaving the website. They are computed by Flink, by aggregating pageview events and other information
To protect our job, we have implemented filtering wherever possible. A rule we have is to filter out invalid data as early in the stream as possible, to avoid causing unnecessary costly operations later in the stream. For example, we have a rule that no more than 300 pageview events can be sent for a given session. Each pageview event is tagged with an incrementing page number indicating its position in the session. When we do receive more than 300 pageview events for a single session, we could filter them out either by:
- counting the number of pageview events for a given window once this window expires
- discarding events for which the page number exceeds 300
The first solution seems more reliable because it does not depend on the value of the page number, but using it means that we are accumulating those 300+ pageview events in our state before being able to exclude them. We chose the second solution instead, which excludes the faulty data right as it enters Flink.
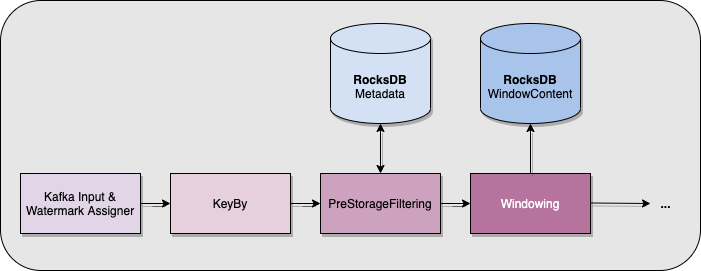
In addition to these kinds of stateless filters, we also needed to exclude data based on metrics related to each key. For example, there is a maximum size in bytes for each session set to 4MB. This number was selected for business reasons, but also to help with one of the RocksDB state limitations in Flink. Indeed, the RocksDB API used by Flink will fail if values are over 2^31 bytes large, so if you are using a ListState as explained above, you need to make sure you have a way of never accumulating too much data.
It is impossible to know the current size of a session when you only have information about the newly consumed event, which means we cannot use the same trick as we did with the page numbers. What we did instead was to store metadata about each key (that is, about each session) inside RocksDB, in a separate ValueState. This metadata is used and updated after the keyBy operator, but before the windowing happens. This means we can protect RocksDB from accumulating too much data in its ListState because, based on this metadata, we know when to stop accepting value for a given key!
9 - The dangers of Event-Time
Event-Time processing is amazing in most cases, but you have to keep something in mind: if your way of handling late data is expensive, there could be some nasty consequences. The problem is not directly tied to Flink though, for us it happened whenever the external component feeding the Kafka topic read by Flink was having problems. Specifically, when this component was consuming certain partitions more slowly than others.
This component (called Asimov) is a simple Akka Streams program that reads a Kafka topic, parses JSON data, translates it in Protobuf and pushes it to another Kafka topic so that Flink can process the Protobuf. Its input is supposed to be ordered in each partition, but since the partitioning is not a 1-to-1 mapping with the output topic, there could be some slight out-of-orderness when Flink eventually processes the messages. This is fine though, because Flink supports out-of-orderness by delaying the watermarks if you set it up this way.
What is not fine is when one partition is read slower than the others by Asimov: this means that Flink’s watermark will progress with the fastest Asimov input partitions (not Flink’s input, where all partitions advance normally), and the slow partition will emit records that have older timestamps. This eventually causes Flink to treat each of these records like a late record! This could be fine, but in our job we handle late records with a specific bit of logic that needs to fetch data from RocksDB and generate an additional message to perform updates downstream. This means that, whenever Asimov was lagging on a few partitions for whatever reason, Flink had way more work to do.

We found two different approaches to fix this problem:
- We could have partitioned Asimov’s input topic in the same way as its output topic (by
userId). This means that when Asimov is lagging on a few partitions, the corresponding partitions in Flink’s input are also lagging, causing the watermark to advance more slowly:
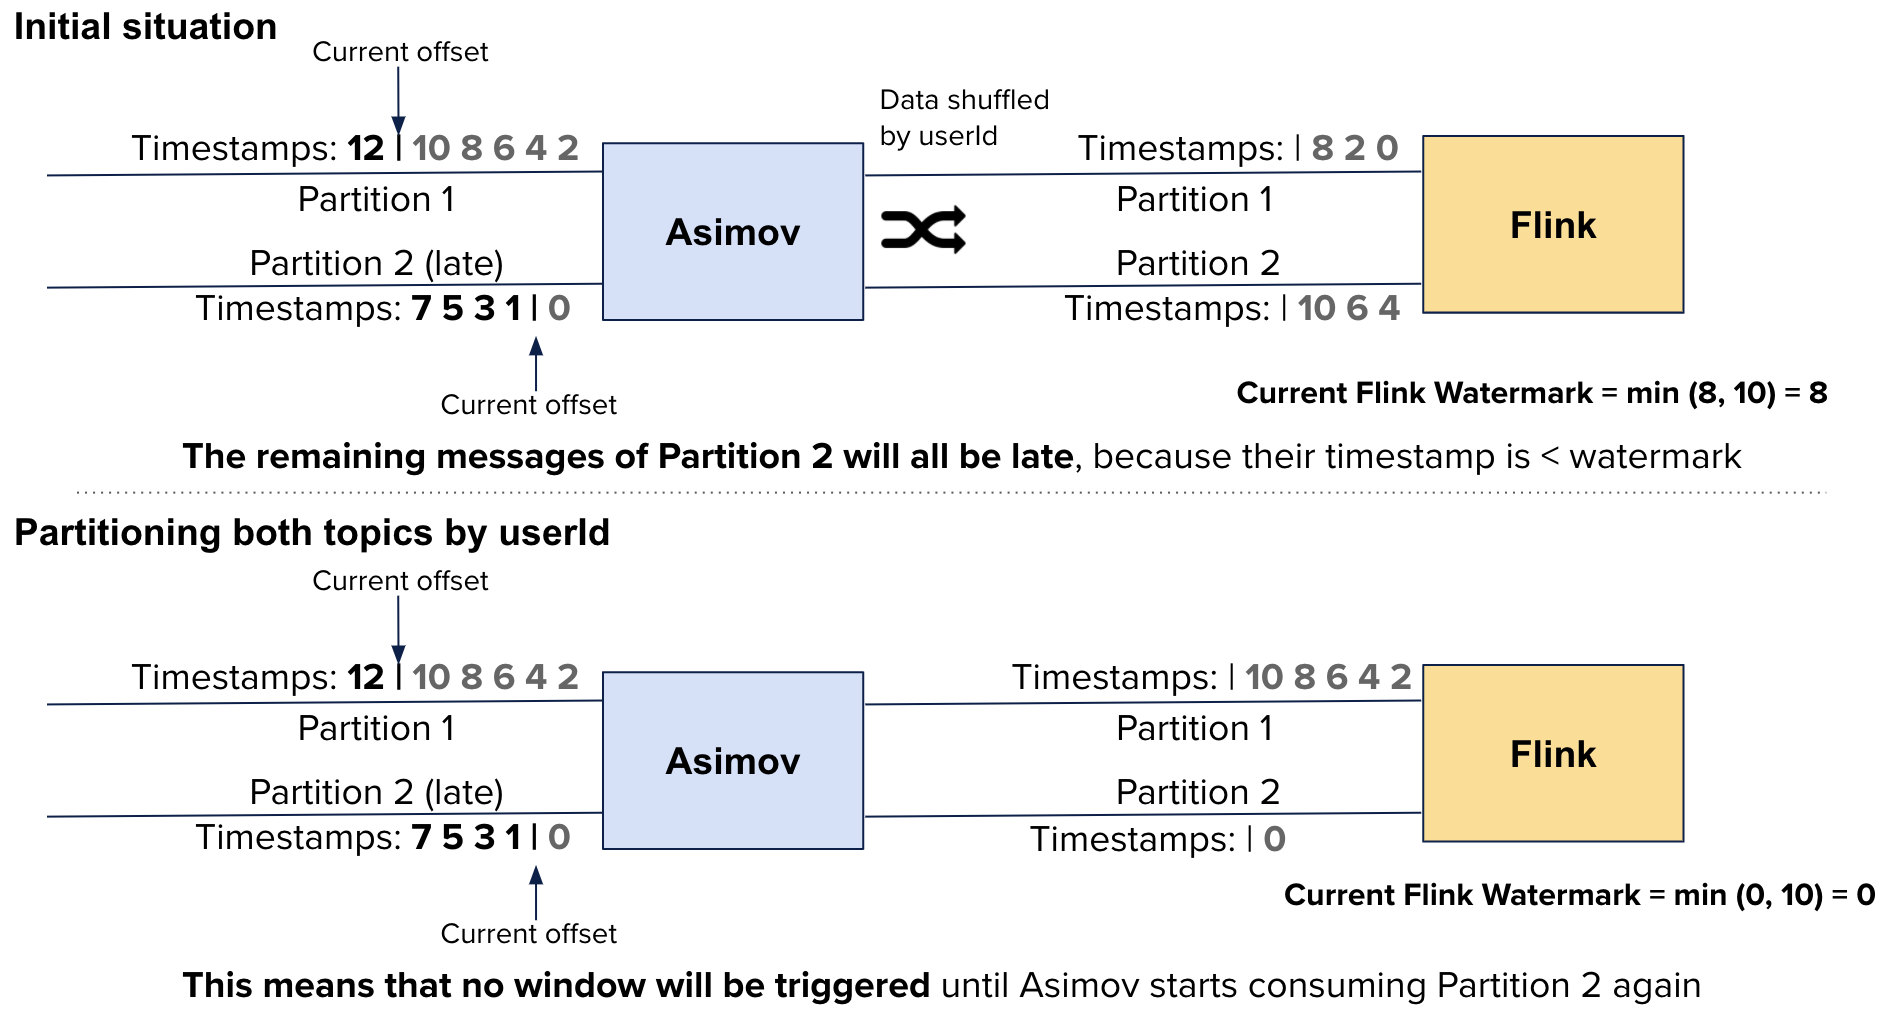
We decided not to do that, because the problem would still have existed if we had lateness before Asimov, forcing us to partition each topic the same way, which wasn’t possible for different reasons
- Another solution relied on batching the late events: if we could delay the processing of late events, we could make sure that each session was producing at most one update, instead of one update per event
Achieving the second solution was done by using a custom Trigger to avoid firing the window whenever a late event arrived. As you can see in the default EventTimeTrigger implementation, there is a specific case for late events that does not register a timer. In our replacement, we register a timer no matter what, and we do not fire the window immediately. Since our business requirements allow us to batch updates this way, we can make sure that we do not generate hundreds of expensive updates when there is lag upstream.
10 - Avoid storing everything in Flink
Let’s finish with some general insight: if your data is large and does not need to be accessed often, it is better to store it outside of Flink. When designing your job, it is understandable that you would want all the needed data to be available directly on the Flink nodes (in RocksDB or in memory). This, of course, makes the use of this data way faster, but when the data is big, it adds a lot of cost to your job. This is due to the fact that Flink’s state is not replicated, so losing a node requires a complete restore from your checkpoints. The checkpointing mechanism itself is also expensive if you constantly have to write hundreds of GB to your checkpoint location.
If accessing your state is a really critical part of your performance needs, then it is definitely worth storing it in Flink, it will handle it. But if you can live with an additional latency, storing it in an external database with replication and fast access to a given record will save you a lot of trouble. For our use case, we chose to keep the WindowContent state in RocksDB, but we moved the HistoricalSessions data into Aerospike. This made our Flink job faster and easier to maintain thanks to a smaller state. We even benefited from the fact that the remaining data stored in Flink was small enough to fit in memory, which let us remove the use of RocksDB and the need for local SSDs.

All in all, working with Flink was a great experience: even though we sometimes had trouble understanding the behavior of the framework, it always made sense in the end. I highly recommend subscribing to the Flink User Mailing List to get additional tips by this very helpful and friendly community!
I would like to thank the Ververica support team, as well as the Contentsquare Data Engineering team who offered their wonderful knowledge and energy making the project possible, specifically Alex Tremoceiro, Paul Lavery, Théo Ropiteaux, Vincent Chenal, Jérome Leclercq, Léo Ercolanelli, Ryad Zenine, Christophe Kalenzaga and Raphael Mazelier for their contributions to this article.