How we improved our Akka Stream application throughput by 6x
At Contentsquare, we rely on a well-crafted ingestion pipeline to reliably and efficiently deliver insights from customer data. To do that, we need to have components that can withstand huge spikes in traffic like Black Friday.
This article will focus on how we improved the throughput of an internal parsing component called Asimov through profiling. It is a tool written in Scala and Akka Streams that reads records in JSON and translates them into Protocol Buffers. Akka Streams is a library providing an API on top of the Actor paradigm for efficient stream processing.
Asimov can be divided into a series of steps described here in chronological order:
- reading from a Kafka topic
- parsing JSON messages (the “JSON step”)
- creating structured Protobuf messages from them with URL parameters parsing & LZString decompression (the “SF step”)
- writing the output to another Kafka topic.
We will focus on the JSON and SF steps as they are the most critical.
How to get valuable insights
Grafana + Prometheus
The first option is to add some metrics that our monitoring infrastructure will scrap and display in a dashboard (Prometheus for scraping, Grafana for display). We will monitor the time spent in each step to see which one is our bottleneck.
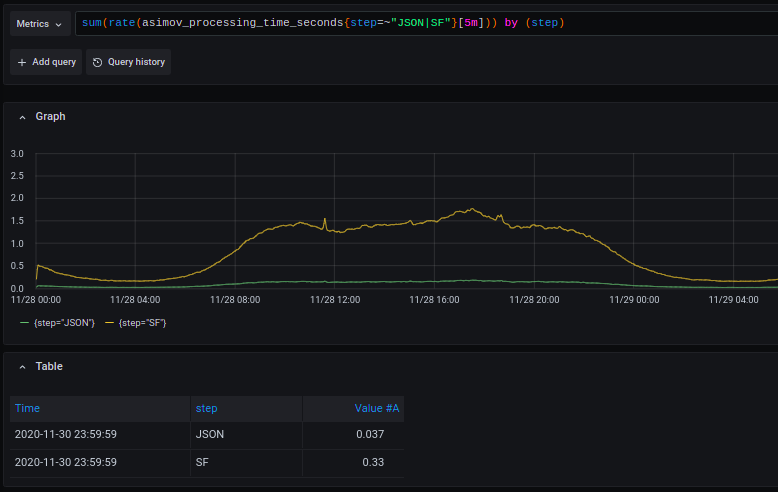
By looking at this graph, we can see that the SF step is our winner!
However, this method is way too custom and inefficient for digging deeper in the bottleneck, as it would require a lot of back and forth to add metrics for each sub-step.
Fortunately, there are better tools to explore our Scala (JVM) component in depth.
VisualVM
VisualVM is a tool that aims to help developers profile their JVM-based components and understand how to improve them.
Setup
You will need to download the VisualVM tool first, and then add some JMX parameters to your application. As we are using Kubernetes, we will use a quick edit command to add those parameters to our pod containing the JVM based application:
# Enter edit mode to change pod configurationkubectl edit deploy
# Add JMX remote options'-Dcom.sun.management.jmxremote','-Dcom.sun.management.jmxremote.port=3000','-Dcom.sun.management.jmxremote.rmi.port=3001','-Dcom.sun.management.jmxremote.ssl=false','-Dcom.sun.management.jmxremote.authenticate=false','-Djava.rmi.server.hostname=127.0.0.1'
# Port forwardkubectl port-forward your_pod 3000 3001
Then, start up VisualVM locally and add a new connection with those parameters:
- Connection:
localhost:3000 - do not require SSL:
true
Threads usage
In the Threads tab, we have real-time data on thread activity (based on Java Management Extensions (JMX)).
We can see timelines for thread activity in Asimov and navigate with more or less details in the UI.
This panel gives a view of the state of every thread in your application. Each color means a different state:
- running: green
- parking: orange
- waiting: yellow
- blocking: sky blue
- sleeping: night blue
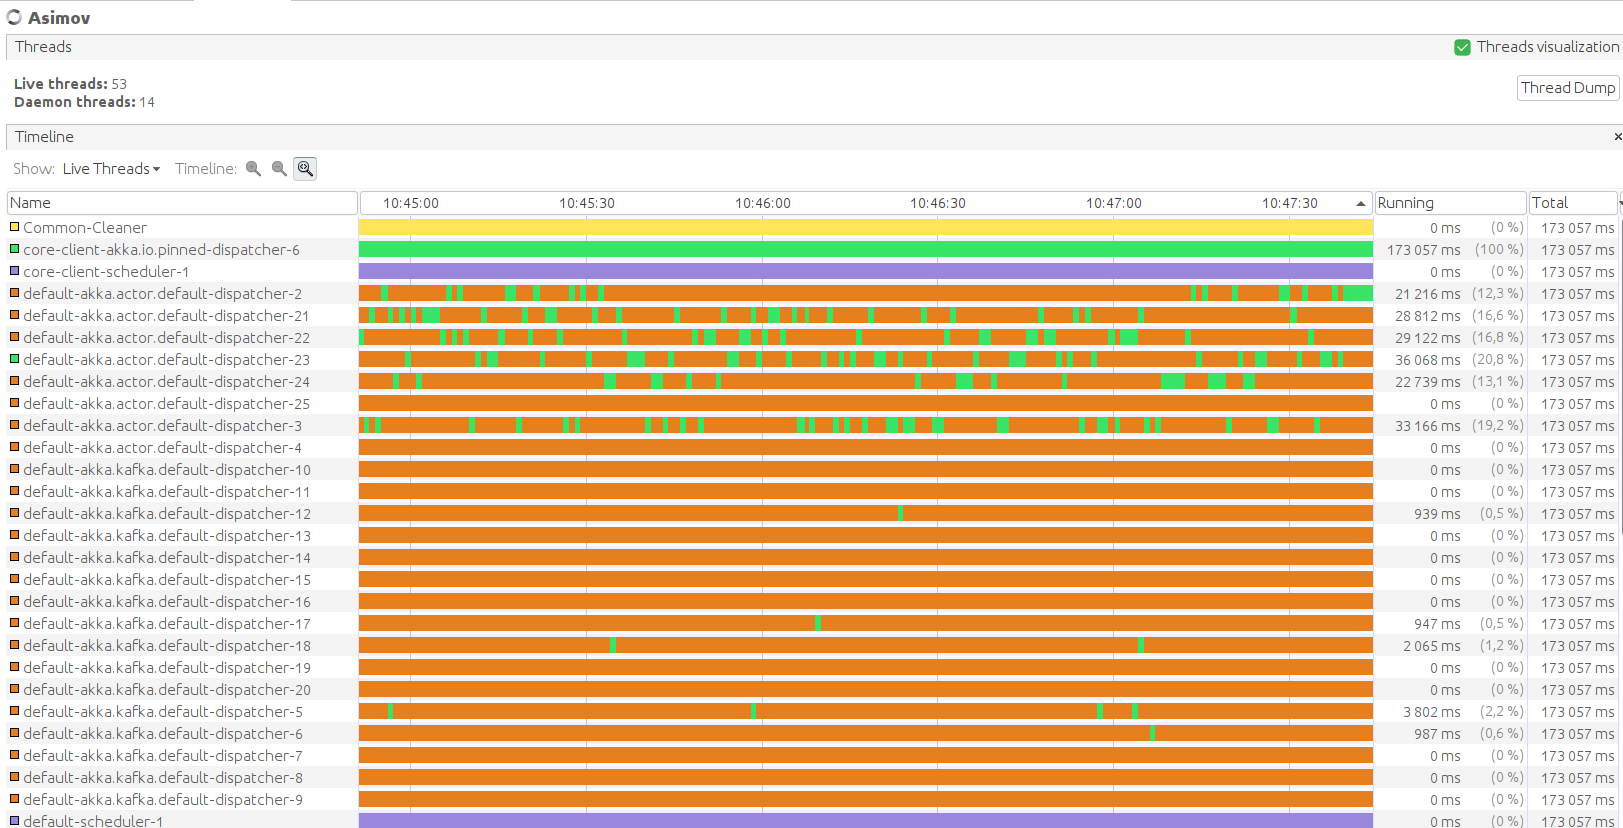
As we can see here, our threads are mostly parking and it means that this is way under-optimized.
CPU allocation
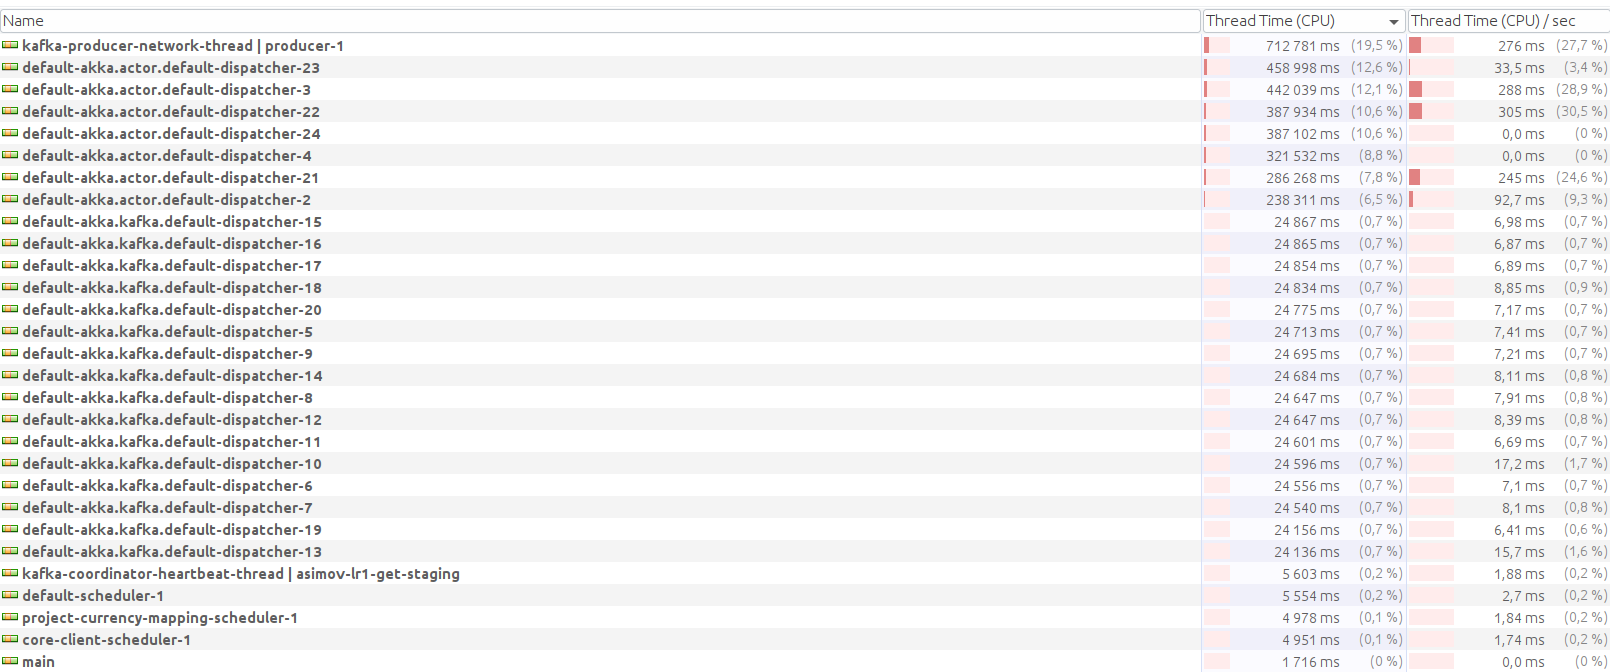
CPU sampling shows us where we spend time in our component. But how do we analyze such information?
- Thread time: How much time the listed method spent executing its own code.
- Thread time (CPU): CPU time actually spent by the method.
- Total time: How much time that method was active.
- Total time (CPU): CPU time the total time actually corresponded to.
Memory Allocation
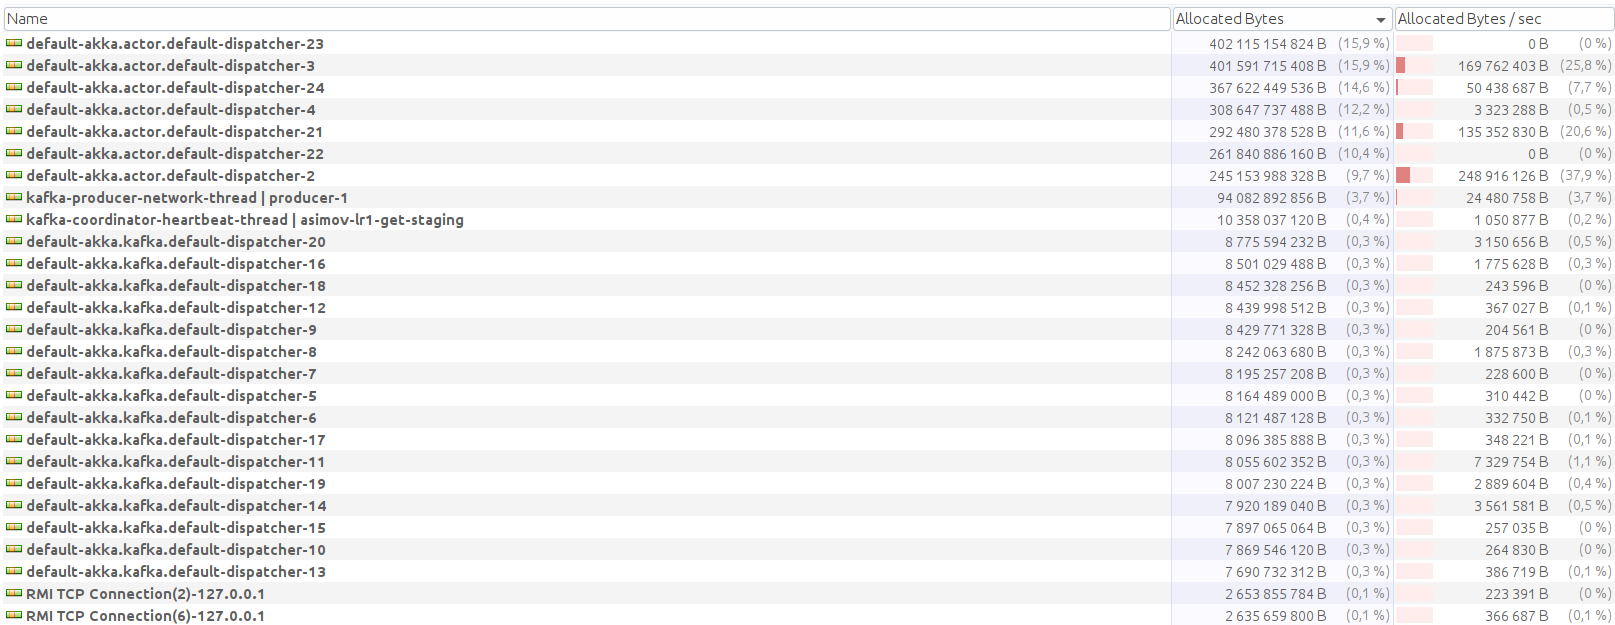
The memory sampler shows us the repartition of the heap’s objects, and their memory footprint. You can see for each function how big of an impact you are making on memory:
Akka Streams layer
Visual VM Hotspots
The Hotspot panel shows you the methods sorted by how much time was spent in it. This is the only way to actually look at our method time, as the Akka layer displays a lot of actors related method in default module, and we do not need it for our use case.

You will need to install additional plugins to be able to use that functionality.
Seconds spent per function
When we use the Hotspot panel on Asimov, here is what we get:

Hurray! Something insightful and reflecting our actual code.
If we look at it, we can observe that:
- 15-20% of the application is spent on LZString (which is part of the SF step)
- 13-15% on JSON operations (Play + Jackson calls)
- 6% on Kafka
SampleStat.record() - 4-5% on spray’s
URIParser
Next steps
What we can infer from the hotspot analysis is that:
- Parallelizing the application will bear the most fruits (shown by low thread activity and the fact that basic Akka Streams operations are not parallelized by default c.f. Akka Streams operators are “fused” together and executed sequentially by default.)
- Using dedicated thread pools for LZString and JSON parsing will help with CPU bound operations
- Changing our JSON library for something faster could be useful
Different approaches
In this section, we will briefly explain the async and mapAsync functions, but if you want to explore those concepts in depth, here is a
very good article by Colin Breck.
Async
As we said before, Akka Streams pipelines are sequential by default. So we will need to change that behavior by adding some asynchronicity in our code, after our most time-consuming step:
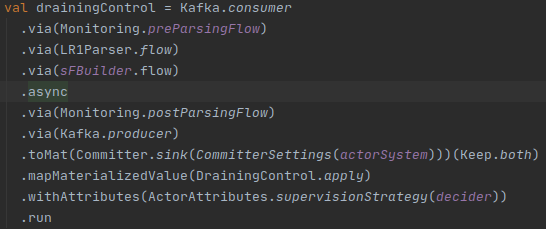
By doing that, we should see an improvement because we added some parallelization, right? Well no, this is not how async works.
It is just that our SF step (sFBuilder.flow) is executed in a separate actor, with asynchronous message-passing between itself and the postParsingFlow.
async should be used with caution, because we are using more than one actor to run our graph, resulting in overhead of communication and synchronization among threads, especially with heavy JSON objects from a parsing component.
So while we did not really introduce some parallelism here, as we can see in Figure 7, it did improve a little (the huge bubble represents the message consumption at the startup of our application, then it comes back to its base value because of the bottleneck). This comes from the fact that our component’s functional logic is pretty sequential.

Let’s look at mapAsync instead.
mapAsync & mapAsyncUnordered
To properly use the mapAsync in the code, we have to transform our flow into a mapper with the same input & output. Here is the JSON step mapper:
def mapper(implicit ec: ExecutionContext): Message[String] => Future[Message[ParsedData] = (msg: Message[String]) => Future(msg.map(parse))The Future will be executed on a thread of the execution context, rather than immediately by the current actor (it manages the completion of each Future, emitting the result downstream) resulting in a more efficient thread activity.
As we can observe on Figure 8, we had a pretty substantial improvement with that strategy, especially by not caring about the order of the messages when they came in that step with mapAsyncUnordered.

After going with the mapAsync instead of mapAsyncUnordered (Kafka offsets would also be unordered and because of that we will lose at-least-once guarantee: Kafka Warning for mapAsyncUnordered), we only gained 2-3x throughput (4x previously).
With one more batch of profiling, we can see that the CPU-bound operations are really costly but the default dispatcher is not well used. We are gonna try to lower the number of threads for the default dispatcher to reduce context switches and add some to the CPU-bound operations.
The code underneath shows how we used the mapAsync in Asimov:
parallelism-LR1 = 8parallelism-SF = 32val drainingControl =Kafka.consumer .via(Monitoring.preParsingFlow) .mapAsync(Settings.ThreadPool.parallelismLR1Parser)(LR1Parser.mapper(actorSystem.dispatchers.defaultGlobalDispatcher)) .mapAsync(Settings.ThreadPool.parallelismSFBuilder)(sFBuilder.mapper(actorSystem.dispatchers.defaultGlobalDispatcher))The right parallelism value for each mapAsync was found by looking at the thread activity after using specific dispatchers though, let’s look at that next!
Dispatchers
In the previous sections, we showed that one of our component called LZString was our bottleneck, and optimizing it would be the biggest breakthrough in our throughput improvement journey.
But what is LZString? LZString is a specialized library we use to compress our messages. As we grew more experienced, some better ways to do that emerged, but changing that piece of code would require a lot of work.
Because we cannot improve the code itself as of now without major testing, we opted to use a custom thread dispatcher to allow more resources towards that CPU-bound operation.
We will use Akka Dispatchers to help us do that.
The main idea is to dedicate more threads for the part using LZString (SF), use the default dispatcher for the rest but reducing the number of threads available, and use a dedicated thread pool for Kafka operations (but with a low thread count).
Here is the part of configuration files allowing us to do that:
# SF dispatcherdispatchers { cpu-dispatcher = $${akka.actor.default-dispatcher} cpu-dispatcher { executor = "fork-join-executor" # Configuration for the fork join pool fork-join-executor { # Min number of threads to cap factor-based parallelism number to parallelism-min = 8 # Parallelism (threads) ... ceil(available processors * factor) parallelism-factor = 1.0 # Max number of threads to cap factor-based parallelism number to parallelism-max = 16 } }}akka.kafka.default-dispatcher { type = "Dispatcher" executor = "thread-pool-executor" thread-pool-executor { fixed-pool-size = 1 }}akka.actor.default-dispatcher { executor = "fork-join-executor" fork-join-executor { parallelism-min = 2 parallelism-factor = 1.0 parallelism-max = 6 }}In these files, the idea is to use the fork-join-executor strategy to let the dispatcher create a number of threads between parallelism-min and parallelism-max, allowing us to specify which thread pool is the heavy lifter.
The rule of thumb we use to choose a parallelism value is to have roughly 4x more threads than CPU (we have 4 CPUs per pod).
We also chose to have 4 CPUs instead of 2 because we have some CRON operations and Kafka operations that are hogging some resources, and using only 2 CPUs was not efficient enough for us to dispatch properly.
To use dispatchers in your code, just use this as ExecutionContext.
val cpuCtx: ExecutionContext = actorSystem.dispatchers.lookup(Settings.ThreadPool.cpuDispatcher)The Figure 9 shows the first time we used dispatchers and how it was not optimized to give more threads to the SF step:

By tuning the parallelism values on the mapAsync and the dispatchers conf, we ended up having this better looking thread activity on our component:
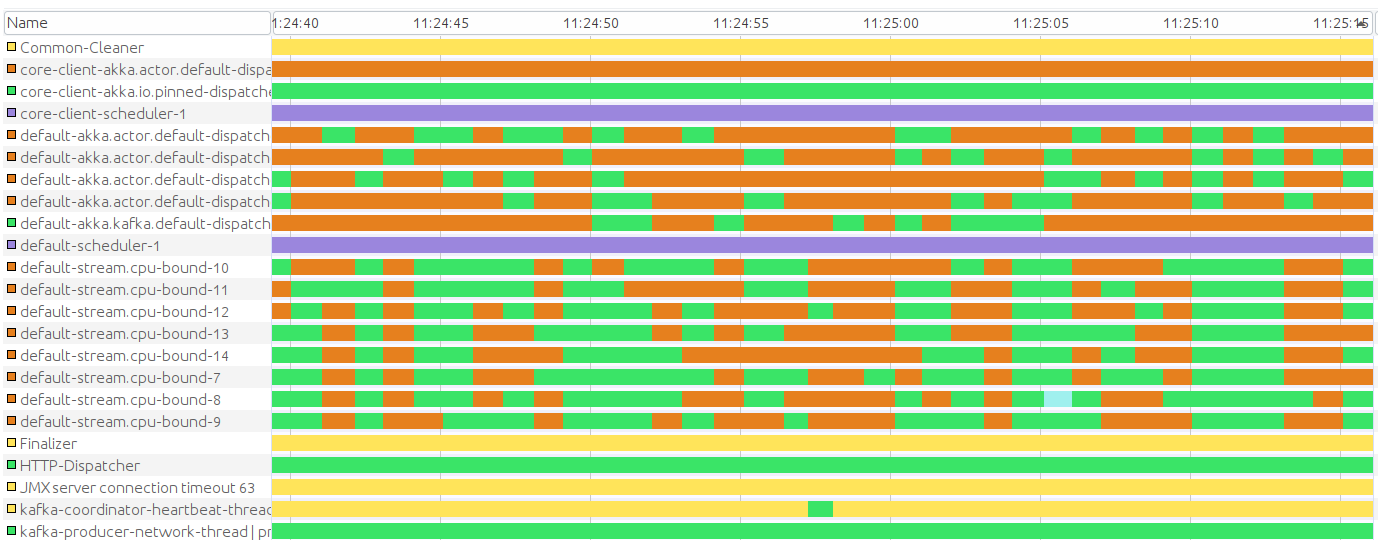
This allowed us to improve our throughput by a factor of 6!

Wrapping up
We could do some more fine tuning, but the added benefits would be minimal and we need to leave CPUs some margin anyway because other features are on the way.
Also, we did not take time to change the JSON parsing library because of two reasons:
- Low reward
- Hidden costs (like QA) needed to validate such a change
Anyway, here are some good candidates we considered:
In the end, we ended up improving Asimov’s throughput from 1.5k messages per second to 10k/s!

Using VisualVM allowed us to focus on improvements that were not so obvious but were the most impactful.
A final key lesson resulting from our analysis is that custom code (LZString) that seems harmless early on may have a dramatic impact years later…
Thanks to Robin Cassan for warning me about mapAsyncUnordered & Hotspots, Ali-firat Kilic about useful knowledge on Akka dispatchers and Ryad Zenine for pointing out the non-default asynchronism of Akka Stream pipelines. Thanks to them plus Raphaël Mazelier, Bertrand Junqua and Sylvain Zimmer for reviewing drafts of this.