From events to Grafana annotation
At some point you are frustrated in monitoring. You have to correlate facts to metrics, and it can become really difficult with monitoring systems. You have dozens of metrics and dashboards but finding a cause to a spike is often a needle in a haystack.

The annotation API at a glance
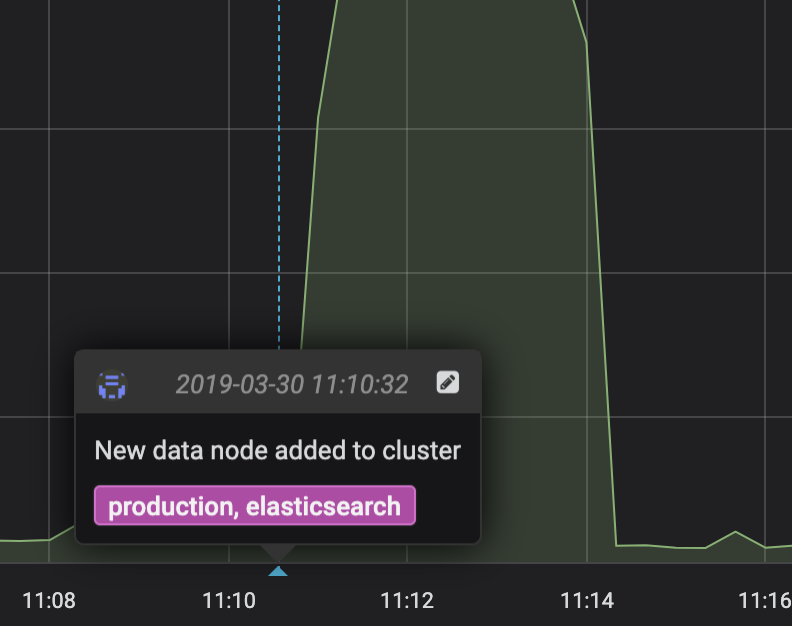
Grafana comes with a native annotation API, that can store and retrieve annotations for dashboards. Adding annotation is very easy and convenient since Grafana 4.6. Just Hold CMD + Click, this will add an annotation at the selected timestamp that will be stored in Grafana database. But, this is clearly a manual step that could be used to explain events afterwards.
Annotations can also be retrieved from other data sources such as Elasticsearch, MySQL/PostgreSQL, Prometheus, but let’s focus on the annotation API ans its in two formats, the native Grafana format and the Graphite format.
The Graphite format
Quick takeaways on choosing the Graphite format:
- dashboard has to be configured to display annotations
- four simple fields “what”, “when”, “data”, and “tags ”
{ "what": "New data node added to cluster", "tags": ["production", "elasticsearch"], "when": 1553941858, "data": "New data node added to production cluster"}Grafana Graphite annotation format
The Grafana native Format:
Quick takeaways on choosing the native format:
- can be linked to a dashboard and panel id (optional).
- can span a time range (with
timeEnd) - millisecond epoch
{ "dashboardId":18, "panelId":5, "time":1553942264215, "isRegion":false, "tags":["production","elasticsearch"], "text":"New data node added to production cluster"}Grafana native annotation format
Manual annotation posting
Posting annotation is fairly easy, just call the right endpoint with the right payload. We’ll use here the graphite API as this annotation is really simple to both implement and understand.
We must be authenticated to use the Grafana APIs. First, create a token. Once done, here you go:
$ curl -H "Content-Type: application/json" -d "{ \  \"what\": \"New data node added to cluster\", \  \"tags\": [\"production\", \"elasticsearch\"], \  \"when\": 1553941858, \  \"data\": \"New data node added to production cluster\" \  }" \  -H "Authorization: Bearer ${TOKEN}" \  -X POST https://grafana.tld.io/api/annotations/graphite
{"id":1899,"message":"Graphite annotation added"}%
Should I really curl Grafana every time ?
Of course no, there are plenty of ways to achieve this. At Contentsquare we often build simple tool to achieve simple actions. https://github.com/Contentsquare/grafana-annotation is one example. We deploy this tool via Ansible on our systems, and can refer to it when needed.
A simple use case is to track systemd services events as follows:
- step one, deploy the Grafana annotation tool
- step two, create a notifier systemd service
- step three, update the target systemd service to track
The Notifier systemd Service:
[Unit]Description=Send grafana annotation on FailureAfter=network.target
[Service]Type=oneshot# The dash means that we don t care about the return code of the notifier, in case of a failure we don t want to hold everything !ExecStart=-/usr/local/bin/grafana-annotation -config-file /etc/grafana-annotation-poster.yml -tag production -tag eu-west-1 -tag kafkacluster -tag systemd -tag failure -what "systemd service failure" -data "hostname=%H,service=%i,state=failure"
[Install]WantedBy=multi-user.target
The Target systemd Service to monitor:
[Unit]Description=Apache Kafka - brokerAfter=network.targetOnFailure=notify-grafana-failure@%i.service
[Service]Type=simpleUser=kafkaGroup=kafkaExecStart=/usr/bin/kafka-server-start /etc/kafka/server.propertiesTimeoutStopSec=180Restart=on-failureEnvironment='KAFKA_JVM_PERFORMANCE_OPTS=-server -XX:+UseG1GC -XX:G1HeapRegionSize=16M -XX:MaxGCPauseMillis=20 -XX:InitiatingHeapOccupancyPercent=35 -XX:+ExplicitGCInvokesConcurrent -Djava.awt.headless=true'Environment='KAFKA_OPTS=-Djava.net.preferIPv4Stack=True'Environment='EXTRA_ARGS=-name kafkaServer'Environment='KAFKA_HEAP_OPTS=-Xms1538m -Xmx1538m -XX:MetaspaceSize=96m -XX:MinMetaspaceFreeRatio=50 -XX:MaxMetaspaceFreeRatio=80'Environment='KAFKA_JMX_OPTS=-javaagent:/opt/jmx-exporter/current/jmx_prometheus_javaagent.jar=9404:/opt/jmx-exporter/current/config.yaml'LimitNOFILE=infinityExecStartPost=-/usr/local/bin/grafana-annotation -config-file /etc/grafana-annotation-poster.yml -tag production -tag kafka-raw  -tag eu-west-1 -tag systemd -tag start -what "systemd service start" -data "hostname=%H,service=kafka,state=start"ExecStopPost=-/usr/local/bin/grafana-annotation -config-file /etc/grafana-annotation-poster.yml -tag production -tag kafka-raw -tag eu-west-1 -tag systemd -tag stop -what "systemd service stop" -data "hostname=%H,service=kafka,state=stop"SuccessExitStatus=143
[Install]WantedBy=multi-user.target
This service will trigger the notifier when started, stopped or failed. OnFailure=notify-grafana-failure@%i.service %i refers to the failing service name. See systemd specifiers for more information.
Grafana annotations on dashboard:
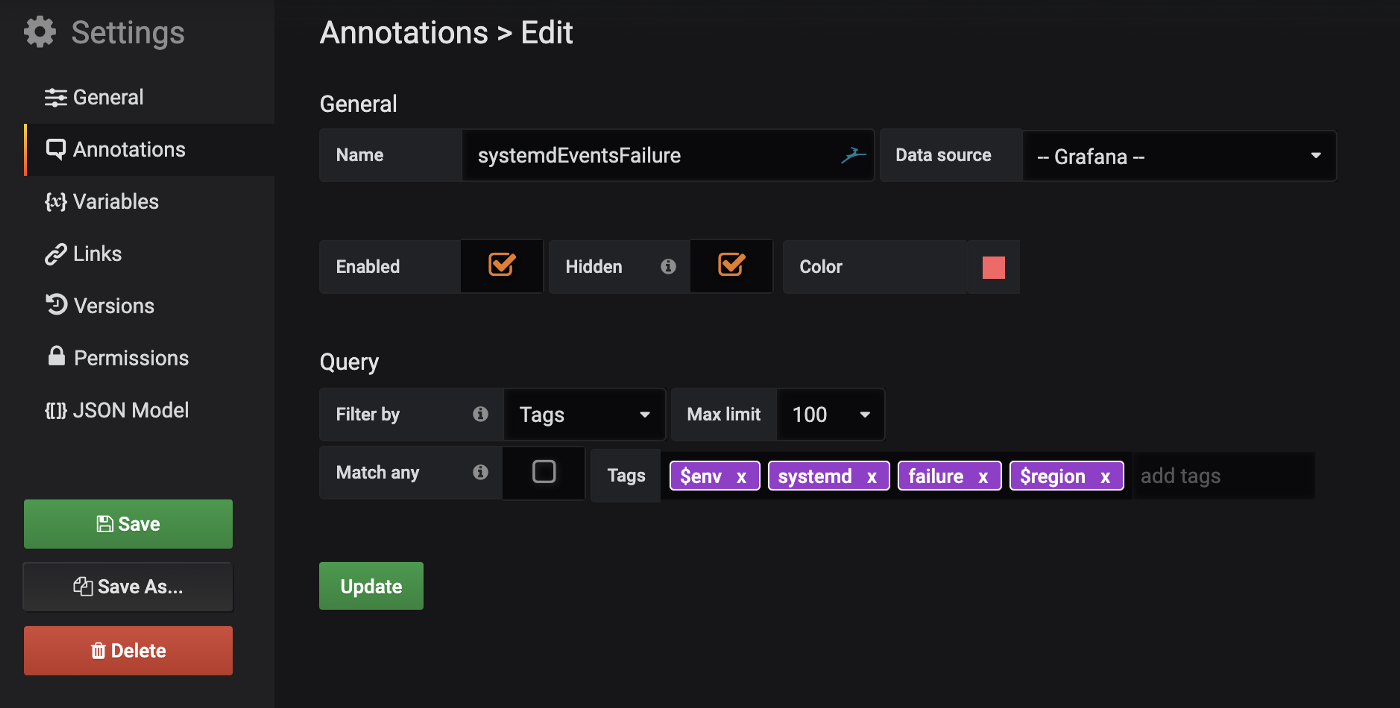
By adding the corrects tags to filter annotations, we will display on the whole dashboard all the corresponding annotations.


To go further
There are plenty of use cases, but let’s imagine a world where all sorts of events could be traced to make sense at some point. For automated workflows like CI/CD pipelines or scaling operations, it is a must!