Kafka topics sizing: how many messages do I store?
At Contentsquare, Kafka is a central component in our data collection pipeline. We want it to be hassle-free for both our developers and our DevOps who maintain all the infrastructure.
Kafka serves two purposes for us:
- Keep a message window that can be reprocessed in case of a disaster or to make it available in another environment for testing purpose.
- Controlling the time we hold the client IP addresses in order for us to be in regulatory and contractual compliance.
As you may know, sizing Kafka topics can be quite difficult. Depending on functional rules or available disk space, choosing the retention configuration for your topics is not that simple.
In this article I will share our experience dealing with such matters.
Size based retention
The first obvious thing is that you avoid running out of disk space. That is why I decided to forecast the usage of my topics and choose the right configurations accordingly. Everyone has its own rules, but basically you start from the available disk space and apply functional rules to split the space between your topics.
Remark: The segment size also has its importance.
When it’s cleaning time for Kafka (one of the retention policy triggers), it will try to remove the oldest segment. But it won’t remove any data if the result topic size is below the target retention.

For example, let’s say we have a retention of 2GB and a segment size of 1GB. Imagine we have two 1GB segments. At the moment Segment 3 is created we are beyond the retention limit. We could have imagined that Kafka would clean Segment 1 but it won’t, otherwise we would have only 1.7GB left in the topic (according to illustrated example) . Once Segment 3 is full, Segment 4 is created and this time Segment 1 is marked for deletion.
Considering this, the worst-case scenario would be when each partition of the topic is “retention + 1 segment” (last column of the example’s spreadsheet).

Retention calculation example
- I have a 3000GB disk. After checking on the machine using
dfand after removing the 5% reserved by system (default in ext4 file system), my available disk space is 2804GB. - Let’s say we reserve 20% for safety, we have 2243GB remaining.
- I want to split my disk between my different topics: compute the right retention.

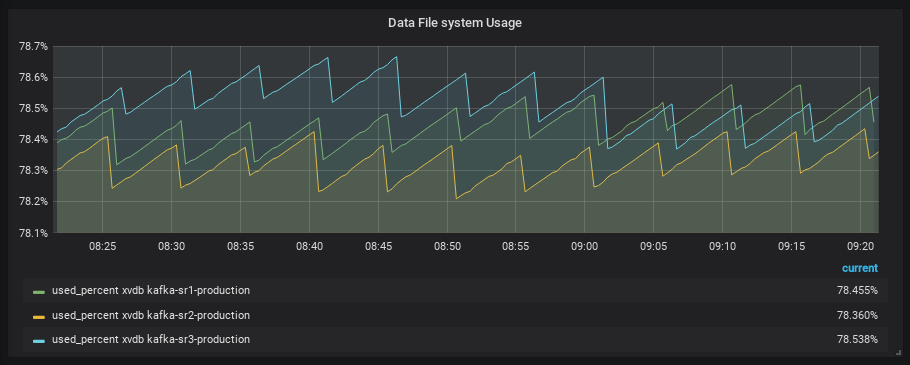
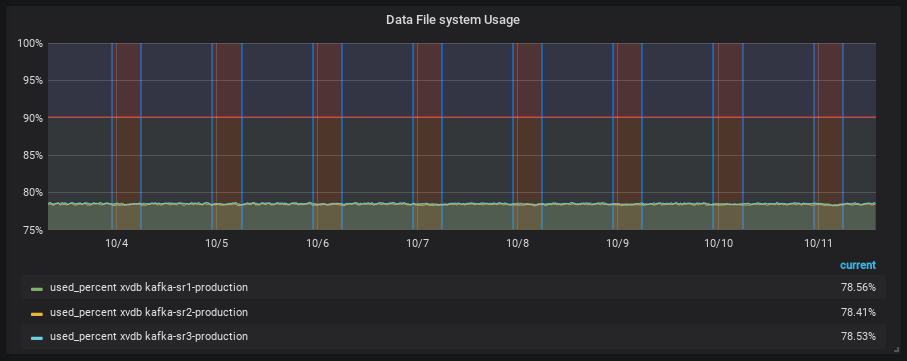
Once your topics are well configured, you will see that you will not take more disk space than your computed worst-case.

Time based retention
One of the goals of Kafka is to keep your messages available for any consumer for a certain amount of time. This allows you to replay the traffic in case of disaster for example.
In some cases, you can’t keep messages longer than a defined window, for legal reasons for instance.
To ensure that, you can specify a retention policy based on time.
This kind of policy allows you not to have more than x days of data. Still do you have enough messages? The time based policy does not ensure you’ll have those x days of data.
Competition between retention policies

Those two kind of retention policies are in competition and the first one triggered wins.
Three scenarios are possible:
- The size based retention you set on your topics corresponds exactly to the time window you defined in your time based retention → Perfect scenario.
- You waste disk space because the time based retention triggers way before the size based retention.
- You have fewer messages than what you would want (time based retention). Your disks are well filled but you have less flexibility in case of disaster.
Introducing a new metric: oldest message per topic
There’s no common metric or tool that gives you the age of the oldest message in a topic (and so the time window you actually store). But it would be useful to adjust your topics retention. Let’s create it yourself!
The main concept is really simple: create a consumer that will consume one message from the beginning of the topic. The timestamp of this unique message is the age we’re looking for.
Implementation example:
#!/bin/bash# Regex to parse timestamp from outputpattern='CreateTime:([0-9]+)'
# Get list of all topicstopic_list=$(kafka-topics \                --list\                --zookeeper <zk_list>for topic in $topic_listdo    # Try to consume one message from each topic    # --timeout-ms is set not to fail in case there are no messages    output=$(kafka-console-consumer \                --bootstrap-server localhost:9092\                --topic $topic\                --group oldest_message \                --from-beginning \                --max-messages 1 \                --timeout-ms 2000 \                --property print.timestamp=true)    [[ $output =~ $pattern ]]    if [ ! -z "${BASH_REMATCH[1]}" ]    then        # If the regex matched a timestamp, print the actual metric for this particular topic        echo "kafka_oldest_message_age{topic=\"$topic\"} ${BASH_REMATCH[1]}"    fidone
The next step is to feed it to our monitoring system. Personally, I used the textfile collector from prometheus/node_exporter. It reads metric files from the configured directory. The script is executed regularly using a cron job directly on the instances and redirects the output in a Prometheus metric file.
Here is the final output in a Grafana table:

Conclusion
Once you have the correct tooling, metrics and visualization you can easily iterate on configurations and you also know that you won’t get out of disk space.
Also, at Contentsquare, we value “Everything as Code” meaning that even the topics configuration is done as code which eases the configuration iterations.
Improvements ideas:
- Convert the script in python or go to avoid launching a JVM each time it’s executed.
- Integrate this new metric in an official tool.
- It could also run from an AWS lambda or any other compute but you would have to insert metrics via the Prometheus Pushgateway for example.