Understanding the layout of web pages using automatic zone recognition
At Contentsquare, we empower our clients to analyze user interactions with every part of their website, from entire pages down to HTML elements. Aggregating the information in human-readable blocks is key; which is why we ask our clients to cluster URLs into pages (list pages, product pages, home pages, etc) and key HTML elements into zones of interest. The image below shows a product page segmented into different zones: search bar, logo, menu, “add to cart” button, and so on.
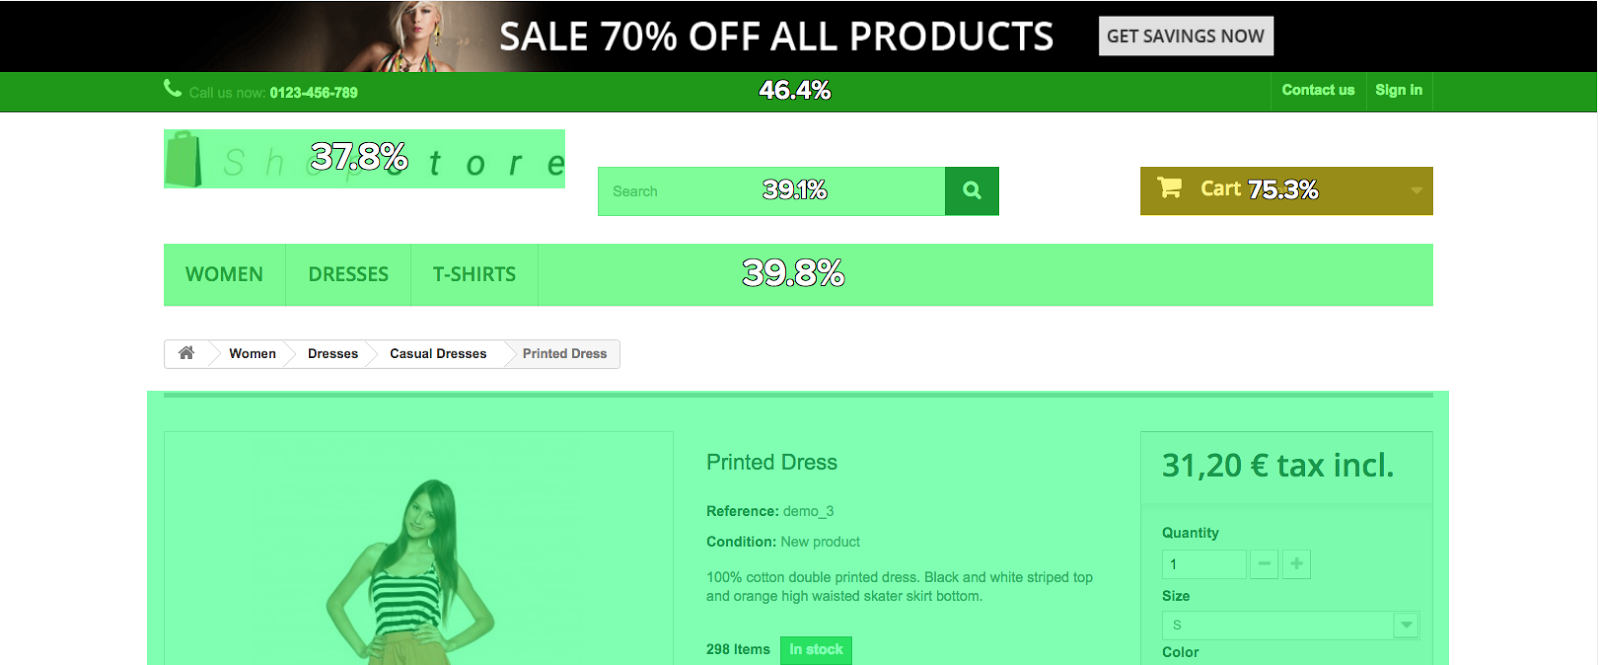
Segmenting a web page similar to the one above, is a time consuming operation, regardless of the tools you use. What if we could automatically find zones of interest and segment web pages? This is what we’d like to focus on in this blog post, so if this topic is of interest, read on.
First thoughts
There are several ways of tackling this problem, depending on the expected result.
A natural approach is to view the problem as a clustering task. HTML elements would be grouped in clusters, and those clusters would constitute the zones of interest we’re after. Those clusters would be unlabelled though: another algorithm would have to label those clusters, that is to infer their category (menu, “add to cart” button, etc).
In our case, we want the algorithm to find and label a few meaningful zones (menu, “add to cart” button, etc) rather than segment the page in unlabelled clusters. For this reason, unsupervised approaches like the one above are not a good match in our context.
There have been papers identifying blocks present across several pages of the website. This is a good idea for zones like the menu, but unfit to our case: the interesting zones frequently live on few pages, like the “add to cart” button that can be found in product pages only.
At Contentsquare, we have listed the most common page and zone categories across e-commerce websites. So it only seems natural to use this domain knowledge and build “zone detectors” rather than “global page segmenters”.
The advantage is that the task at hand is reduced to supervised binary classification: is this HTML element the root HTML element of the DOM subtree constituting the menu? Performance evaluation is easy and many algorithms exist.
The downside to this is that we need to build a model for every zone!
Nevertheless this is the solution we adopted and, as a proof of concept we set out to build models that detect menus and “add to cart” buttons in product pages. In our first iteration, we trained a classifier that assigns to every HTML element a score of being the zone of interest. The element with highest score is then selected to be the zone of interest.
Throughout the rest of the article, we will use menus and “add to cart” buttons on product pages as examples of zones of interest.
Gathering the data
To detect menus and “add to cart” buttons on product pages, we needed a fair number of product pages. So we built a crawler that collects product pages. We collected more than a thousand of them from numerous websites.
Next, we developed a small web interface that allowed us to tag HTML elements as “menu” and “add to cart” button. Let me thank the colleagues who spent several hours tagging pages for us!
Technically, a JS script was injected into the web page. This script allowed the user to select HTML elements with the mouse and assign them a category.
Once finished, we had a dataset of 1,089 product pages with a tagged menu and 1,102 product pages with a tagged “add to cart” button.
The algorithm
The algorithm is divided into four steps (see figure 2):
- Web page scraping: a JS script run by PhantomJs extracts data about the different HTML elements of the page.
- Feature transformation: the data scraped from the web page is transformed into a proper set of features for all HTML elements. Bag of words models for text data, standardization for numerical data, etc.
- Prediction of the probability of being the zone of interest (for example the menu) for all HTML elements.
- Selection of the zone of interest from the probabilities outputted at step 3. In this first iteration, the HTML element with highest score is selected.
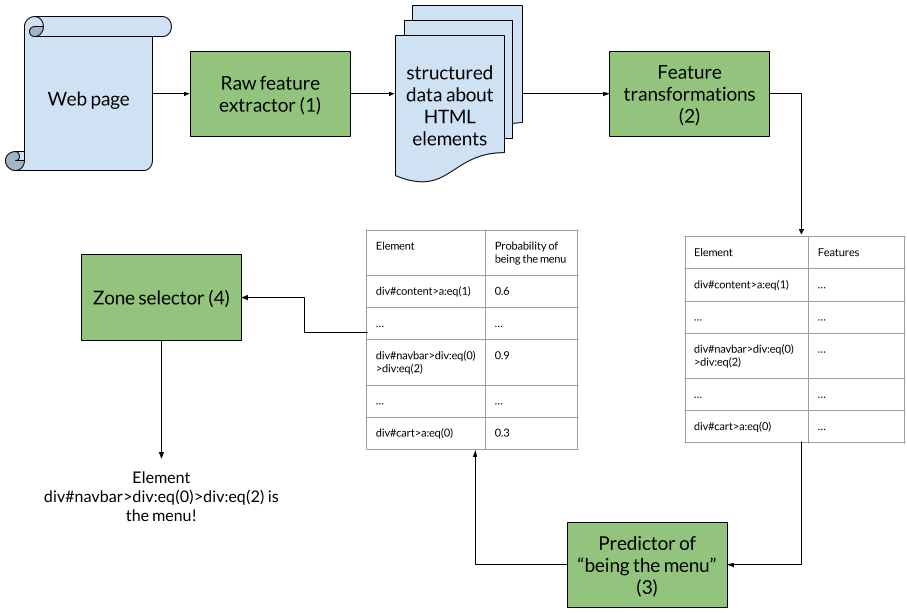
In this image, HTML elements are represented by their path in the DOM tree: “div#content>a:eq(1)” means the second “a” tag within a “div” tag with id “content”.
Web page scraping
We extract all kinds of information from the web page: from the size of HTML elements and their position in the DOM tree to their ids and CSS class names.
To perform this task, we use a JS script that is run by PhantomJS. It produces a text file containing structured JSON objects for almost every HTML element in the page.
At this step, we only filter out elements which have no chance of being a zone of interest, such as special HTML tags or “non-physical” elements.
Feature transformation
Once structured data is extracted for each HTML element, they have to be turned into proper feature vectors. We have tried many features and preprocessing steps as part of our cross-validation routine, and we kept the ones yielding best performance and moved them in the final model.
As we will see below, developer data like element id and CSS class names represent a huge amount of information. We separated the words according to all possible naming conventions: camel case, pascal case, underscores, hyphens, etc. Then a bag-of-words model was applied to the obtained words. This allowed us to capture the semantic meaning chosen by the developer. Of course, it is implicitly assumed that the developer gives meaningful names to their entities: poorly written or obfuscated source code is not supported at this time.
Among the numerical features we have extracted from the HTML elements, some have a great impact on the performance of the model. Let’s mention width and height of the element, depth and number of descendants in the DOM. We applied standardization before logistic regression, and no feature transformation before random forests.
Machine learning
As mentioned above, our algorithm yields the probability of being the menu for every HTML element. The menu is selected based on those probabilities.
This way, we have effectively reduced the problem to the task of classifying elements as “menu” and “non-menu”. The image below gives an overview of the dataset. For every page, there is one unique element with the label set to 1.
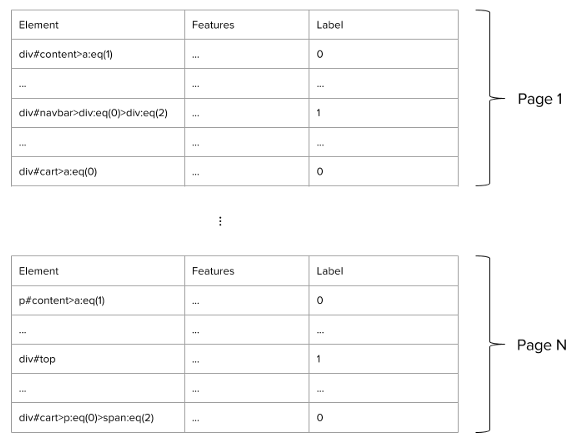
Since the final selection of the zone of interest is based on probabilities assigned to the HTML elements, we used classifiers that naturally yield probabilities and scores, like logistic regression and random forests (in contrast with SVM for instance).
For cross-validation and grid-searching on parameters, we used a custom loss function representing our task: the proportion of web pages in our dataset for which the algorithm selected the correct zone.
This loss function is rather binary though: it does not take into account how “far” the predicted zone of interest is from the actual one. So we also worked on finer loss functions that take into account the severity of the error: distance in the DOM tree and area overlap between the two elements. Still, as a first step, we decided to stick to a metric that would be easy to explain to the stakeholders for our proof of concept.
Results and numbers
We divided our two 1000-page datasets for “menu” and “add to cart” button into training and test sets with a ratio of 70/30.
We mainly tested logistic regression and random forests, and the best-performing model was the random forest classifier. This is no surprise since decision trees are more susceptible to capture the nonlinear relationships present in the DOM tree.
Here is the overall performance of the random forest classifier on the test set:
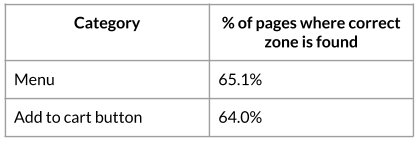
This performance is both encouraging and disappointing. Encouraging, because out of the thousands of HTML elements of a web page, the precise good one is found 3 out of 5 times. Disappointing, because a customer of our solution will expect better performance.
So we decided to measure the severity of the error using the distance in the DOM tree:
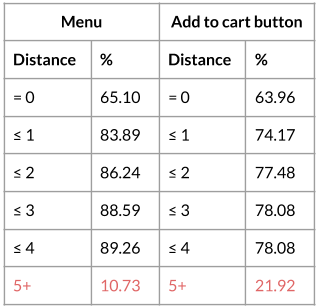
The model detects 4 menus out of 5 with a distance less or equal to one in the DOM tree, and 3 “add to cart” buttons out of 4.
The predictions are somehow completely off on some pages, according to this DOM tree distance (the 5+ row). Again, to ease our minds, we visually checked some of the results.
In the two examples below, the blue zone is the menu tagged by a human operator, and the red one is predicted by the model. One can see that the results are visually satisfying, which is what we aim for in the end. As a side note, the choices made by the algorithm are as justifiable as those made by the human operator.

Of course, the predictions of the model were completely invalid on some pages. More often than not, it is not clear an actual menu exists on those pages, but the human operator made a (dubious) choice nonetheless.

It is also interesting to review the importance of the features used by the algorithms. Those three broad categories of features were highly ranked by our best random forest model for menu detection:
- Dimension and position of the HTML element
- Words
menu,nav,navbar, etc in the id or class names of the HTML element - Depth and number of descendants of the HTML element in the DOM tree
Closing thoughts
The results described above make it impossible to leave the whole task of segmenting web pages to the machine. We would need a much higher accuracy for that. Yet, the algorithm can be leveraged to provide the user with suggestions of zones to be created. This kind of assistant can save a lot of time for novice users.
There are many areas of improvement to be explored in the future. Gathering the data is expensive, yet we are confident that more pages in our datasets will result in increased performance; the model that will serve our customers will be trained over a bigger and cleaner dataset. Indeed, the tagging of the zones of interest by the human operator is key, and we have seen that different people produce different quality levels. We would surely benefit from cross-checking.
Also, we have opted for a solution wherein a model is created for every type of zone. Creating proper datasets will require some investment: it is unclear how to gather other categories of pages, for instance list pages or cart pages; besides, once this is done, the human operators will be required to tag all those pages.
There is also much to be done regarding the model. First, producing a probability for every HTML element and selecting the most probable element to be the zone of interest can certainly be regarded as naive. A more elaborate model would leverage the tree structure of the DOM to yield better performance.
Also, some natural special cases are not handled. What if there is no menu? It is better to detect no menu than a bad menu. Besides, several instances of a same zone of interest may exist in a page (product cards in a list page for instance) and the algorithm should support it.
Eventually, much work could be done on the machine learning part itself. There are many features we have not tried, and we have only used simple models. Indeed, the objective was to provide a proof of concept for a machine-learning-based detector and labeller of zones of interest!
If you have read this far, I hope you have enjoyed yourself as much as we have, working on this proof of concept. On our side, we are eager to go to the next level and push this into production. If you feel like learning more or want to help us build products to increase user experience on all kinds of websites, do not hesitate to reach out!